Sallie Mae 2010 Annual Report Download - page 49
Download and view the complete annual report
Please find page 49 of the 2010 Sallie Mae annual report below. You can navigate through the pages in the report by either clicking on the pages listed below, or by using the keyword search tool below to find specific information within the annual report.-
 1
1 -
2
-
3
-
4
-
5
-
6
-
7
-
8
-
9
-
10
-
11
-
12
-
13
-
14
-
15
-
16
-
17
-
18
-
19
-
20
-
21
-
22
-
23
-
24
-
25
-
26
-
27
-
28
-
29
-
30
-
31
-
32
-
33
-
34
-
35
-
36
-
37
-
38
-
 39
39 -
 40
40 -
 41
41 -
 42
42 -
 43
43 -
 44
44 -
 45
45 -
 46
46 -
 47
47 -
 48
48 -
 49
49 -
 50
50 -
 51
51 -
 52
52 -
 53
53 -
 54
54 -
 55
55 -
 56
56 -
 57
57 -
 58
58 -
 59
59 -
60
-
61
-
62
-
63
-
64
-
65
-
66
-
67
-
68
-
69
-
70
-
71
-
72
-
73
-
74
-
75
-
76
-
77
-
78
-
79
-
80
-
81
-
82
-
83
-
84
-
85
-
86
-
87
-
88
-
89
-
90
-
91
-
92
-
93
-
94
-
95
-
96
-
97
-
98
-
99
-
100
-
101
-
102
-
103
-
104
-
105
-
106
-
107
-
108
-
109
-
110
-
111
-
112
-
113
-
114
-
115
-
116
-
117
-
118
-
119
-
120
-
121
-
122
-
123
-
124
-
125
-
126
-
127
-
128
-
129
-
130
-
131
-
132
-
133
-
134
-
135
-
136
-
137
-
138
-
139
-
140
-
141
-
142
-
143
-
144
-
145
-
146
-
147
-
148
-
149
-
150
-
151
-
152
-
153
-
154
-
155
-
156
-
157
-
158
-
159
-
160
-
161
-
162
-
163
-
164
-
165
-
166
-
167
-
168
-
169
-
170
-
171
-
172
-
173
-
174
-
175
-
176
-
177
-
178
-
179
-
180
-
181
-
182
-
183
-
184
-
185
-
186
-
187
-
188
-
189
-
190
-
191
-
192
-
193
-
194
-
195
-
196
-
197
-
198
-
199
-
200
-
201
-
202
-
203
-
204
-
205
-
206
-
207
-
208
-
209
-
210
-
211
-
212
-
213
-
214
-
215
-
216
-
217
-
218
-
219
-
220
-
221
-
222
-
223
-
224
-
225
-
226
 |
 |

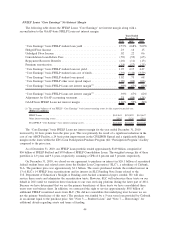
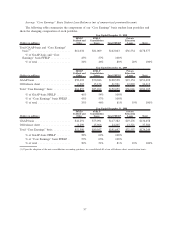
Consumer Lending “Core Earnings” Net Interest Margin
The following table shows the Consumer Lending “Core Earnings” net interest margin along with a
reconciliation to the GAAP-basis Consumer Lending net interest margin before provisions for loan losses.
2010 2009 2008
Years Ended December 31,
“Core Earnings” basis Private Education Student Loan yield . . .......... 6.15% 5.99% 8.16%
Discount amortization......................................... .29 .26 .28
“Core Earnings” basis Private Education Loan net yield ............... 6.44 6.25 8.44
“Core Earnings” basis Private Education Loan cost of funds . . .......... (1.79) (1.78) (3.52)
“Core Earnings” basis Private Education Loan spread ................. 4.65 4.47 4.92
“Core Earnings” basis other asset spread impact ..................... (.80) (.62) (.54)
“Core Earnings” basis Consumer Lending net interest margin
(1)
.......... 3.85% 3.85% 4.38%
“Core Earnings” basis Consumer Lending net interest margin
(1)
.......... 3.85% 3.85% 4.38%
Adjustment for GAAP accounting treatment ........................ .02 (.16) (.02)
GAAP-basis Consumer Lending net interest margin
(1)
................. 3.87% 3.69% 4.36%
(1) The average balances of our Consumer Lending “Core Earnings” basis interest-earning assets for the respective periods are:
(Dollars in millions)
Private Education Loans . . .......................................... $36,534 $36,046 $32,597
Other interest-earning assets ......................................... 5,204 4,072 2,806
Total Consumer Lending “Core Earnings” basis interest-earning assets. . ............ $41,738 $40,118 $35,403
The Consumer Lending net interest margin for the year ended December 31, 2010 remained unchanged
from the prior year. The decrease in the net interest margin from 2008 to 2009 was primarily a result of a
higher costs of funds due to the extreme turmoil in the capital markets.
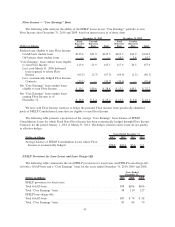
Private Education Loans Provisions for Loan Losses and Loan Charge-Offs
The following tables summarize the total Private Education Loans provisions for loan losses and charge-offs
on both a GAAP-basis and a “Core Earnings” basis for the years ended December 31, 2010, 2009 and 2008.
(Dollars in millions) 2010 2009 2008
Years Ended December 31,
Private Education Loans provision for loan losses:
Total GAAP-basis ......................................... $1,298 $ 967 $586
Total “Core Earnings” basis .................................. 1,298 1,399 874
Private Education Loans charge-offs:
Total GAAP-basis ......................................... $1,291 $ 876 $320
Total “Core Earnings” basis .................................. 1,291 1,299 473
The 2010 “Core Earnings” basis provision expense and charge-offs are down from 2009 as the portfolio’s
credit performance continued to improve since the weakening in the U.S. economy that began in 2008. The
Private Education Loan portfolio experienced a significant increase in delinquencies through the first quarter
of 2009 (delinquencies as a percentage of loans in repayment were 13.4 percent at March 31, 2009); however,
delinquencies as a percentage of loans in repayment have now declined to 10.6 percent at December 31, 2010.
“Core Earnings” basis Private Education Loan delinquencies as a percentage of loans in repayment decreased
from 12.1 percent to 10.6 percent from December 31, 2009 to December 31, 2010. “Core Earnings” Private
Education Loans in forbearance as a percentage of loans in repayment and forbearance decreased from
5.5 percent at December 31, 2009 to 4.6 percent at December 31, 2010. The “Core Earnings” basis Private
48