Sallie Mae 2010 Annual Report Download - page 190
Download and view the complete annual report
Please find page 190 of the 2010 Sallie Mae annual report below. You can navigate through the pages in the report by either clicking on the pages listed below, or by using the keyword search tool below to find specific information within the annual report.-
 1
1 -
2
-
3
-
4
-
5
-
6
-
7
-
8
-
9
-
10
-
11
-
12
-
13
-
14
-
15
-
16
-
17
-
18
-
19
-
20
-
21
-
22
-
23
-
24
-
25
-
26
-
27
-
28
-
29
-
30
-
31
-
32
-
33
-
34
-
35
-
36
-
37
-
38
-
39
-
40
-
41
-
42
-
43
-
44
-
45
-
46
-
47
-
48
-
49
-
50
-
51
-
52
-
53
-
54
-
55
-
56
-
57
-
58
-
59
-
60
-
61
-
62
-
63
-
64
-
65
-
66
-
67
-
68
-
69
-
70
-
71
-
72
-
73
-
74
-
75
-
76
-
77
-
78
-
79
-
80
-
81
-
82
-
83
-
84
-
85
-
86
-
87
-
88
-
89
-
90
-
91
-
92
-
93
-
94
-
95
-
96
-
97
-
98
-
99
-
100
-
101
-
102
-
103
-
104
-
105
-
106
-
107
-
108
-
109
-
110
-
111
-
112
-
113
-
114
-
115
-
116
-
117
-
118
-
119
-
120
-
121
-
122
-
123
-
124
-
125
-
126
-
127
-
128
-
129
-
130
-
131
-
132
-
133
-
134
-
135
-
136
-
137
-
138
-
139
-
140
-
141
-
142
-
143
-
144
-
145
-
146
-
147
-
148
-
149
-
150
-
151
-
152
-
153
-
154
-
155
-
156
-
157
-
158
-
159
-
160
-
161
-
162
-
163
-
164
-
165
-
166
-
167
-
168
-
169
-
170
-
171
-
172
-
173
-
174
-
175
-
176
-
177
-
178
-
179
-
 180
180 -
 181
181 -
 182
182 -
 183
183 -
 184
184 -
 185
185 -
 186
186 -
 187
187 -
 188
188 -
 189
189 -
 190
190 -
 191
191 -
 192
192 -
 193
193 -
 194
194 -
 195
195 -
 196
196 -
 197
197 -
 198
198 -
 199
199 -
 200
200 -
201
-
202
-
203
-
204
-
205
-
206
-
207
-
208
-
209
-
210
-
211
-
212
-
213
-
214
-
215
-
216
-
217
-
218
-
219
-
220
-
221
-
222
-
223
-
224
-
225
-
226
 |
 |

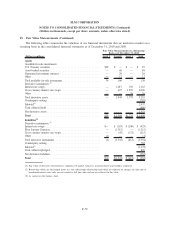
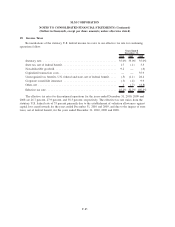
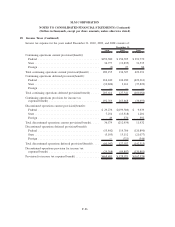
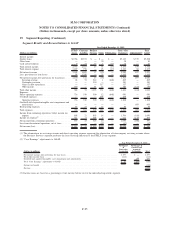
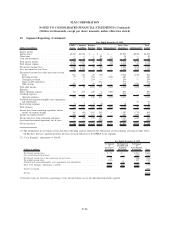
18. Income Taxes (Continued)
At December 31, 2010 and 2009, the tax effect of temporary differences that give rise to deferred tax
assets and liabilities include the following:
2010 2009
December 31,
Deferred tax assets:
Loan reserves .......................................... $ 908,781 $ 737,762
Market value adjustments on student loans, investments and
derivatives ........................................... 480,292 496,101
Intangible assets ........................................ 79,960 —
Stock-based compensation plans ............................. 73,182 70,528
Deferred revenue ........................................ 70,830 83,042
Accrued expenses not currently deductible ..................... 53,010 47,249
Purchased paper impairments ............................... 51,081 42,892
Student loan premiums and discounts, net...................... 47,205 55,918
Unrealized investment losses ............................... 25,302 25,949
Operating loss and credit carryovers .......................... 21,775 36,747
Other................................................. 5,721 50,962
Total deferred tax assets ................................... 1,817,139 1,647,150
Deferred tax liabilities:
Gains/(losses) on repurchased debt ........................... 299,634 187,505
Securitization transactions . . ............................... — 93,254
Leases ................................................ 53,267 64,246
Intangible assets ........................................ — 52,971
Other................................................. 26,053 38,646
Total deferred tax liabilities . ............................... 378,954 436,622
Net deferred tax assets .................................... $1,438,185 $1,210,528
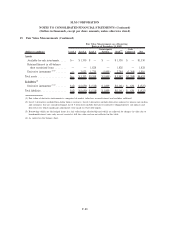
Included in other deferred tax assets is a valuation allowance of $33,488 and $25,111 as of December 31,
2010 and 2009, respectively, against a portion of our federal, state and international deferred tax assets. The
valuation allowance is primarily attributable to deferred tax assets for federal and state capital loss carryovers
and state net operating loss carryovers that management believes it is more likely than not will expire prior to
being realized. The change in the valuation allowance primarily resulted from capital losses associated with
our Purchased Paper business. The ultimate realization of the deferred tax assets is dependent upon the
generation of future taxable income of the appropriate character (i.e. capital or ordinary) during the period in
which the temporary differences become deductible. Management considers, among other things, the economic
slowdown, the scheduled reversals of deferred tax liabilities, and the history of positive taxable income
available for net operating loss carrybacks in evaluating the realizability of the deferred tax assets.
As of December 31, 2010, we have apportioned state net operating loss carryforwards of $374,230 which
begin to expire in 2011, state capital loss carryovers of $5,425 which begin to expire in 2012, and federal and
state credit carryovers of $441 which begin to expire in 2021.
F-87
SLM CORPORATION
NOTES TO CONSOLIDATED FINANCIAL STATEMENTS (Continued)
(Dollars in thousands, except per share amounts, unless otherwise stated)