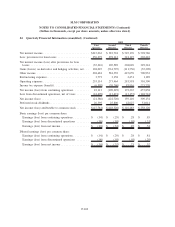
Sallie Mae 2010 Annual Report Download - page 215
Download and view the complete annual report
Please find page 215 of the 2010 Sallie Mae annual report below. You can navigate through the pages in the report by either clicking on the pages listed below, or by using the keyword search tool below to find specific information within the annual report.-
 1
1 -
2
-
3
-
4
-
5
-
6
-
7
-
8
-
9
-
10
-
11
-
12
-
13
-
14
-
15
-
16
-
17
-
18
-
19
-
20
-
21
-
22
-
23
-
24
-
25
-
26
-
27
-
28
-
29
-
30
-
31
-
32
-
33
-
34
-
35
-
36
-
37
-
38
-
39
-
40
-
41
-
42
-
43
-
44
-
45
-
46
-
47
-
48
-
49
-
50
-
51
-
52
-
53
-
54
-
55
-
56
-
57
-
58
-
59
-
60
-
61
-
62
-
63
-
64
-
65
-
66
-
67
-
68
-
69
-
70
-
71
-
72
-
73
-
74
-
75
-
76
-
77
-
78
-
79
-
80
-
81
-
82
-
83
-
84
-
85
-
86
-
87
-
88
-
89
-
90
-
91
-
92
-
93
-
94
-
95
-
96
-
97
-
98
-
99
-
100
-
101
-
102
-
103
-
104
-
105
-
106
-
107
-
108
-
109
-
110
-
111
-
112
-
113
-
114
-
115
-
116
-
117
-
118
-
119
-
120
-
121
-
122
-
123
-
124
-
125
-
126
-
127
-
128
-
129
-
130
-
131
-
132
-
133
-
134
-
135
-
136
-
137
-
138
-
139
-
140
-
141
-
142
-
143
-
144
-
145
-
146
-
147
-
148
-
149
-
150
-
151
-
152
-
153
-
154
-
155
-
156
-
157
-
158
-
159
-
160
-
161
-
162
-
163
-
164
-
165
-
166
-
167
-
168
-
169
-
170
-
171
-
172
-
173
-
174
-
175
-
176
-
177
-
178
-
179
-
180
-
181
-
182
-
183
-
184
-
185
-
186
-
187
-
188
-
189
-
190
-
191
-
192
-
193
-
194
-
195
-
196
-
197
-
198
-
199
-
200
-
201
-
202
-
203
-
204
-
 205
205 -
 206
206 -
 207
207 -
 208
208 -
 209
209 -
 210
210 -
 211
211 -
 212
212 -
 213
213 -
 214
214 -
 215
215 -
 216
216 -
 217
217 -
 218
218 -
 219
219 -
 220
220 -
 221
221 -
 222
222 -
 223
223 -
 224
224 -
 225
225 -
226
 |
 |

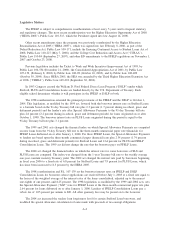
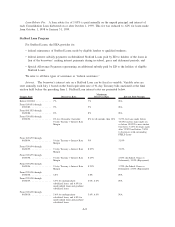
The trigger date for Stafford Loans made before October 1, 1992 is the first day of the enrollment period
for which the borrower’s first Stafford Loan is made. The trigger date for Stafford Loans made on or after
October 1, 1992 is the date of the disbursement of the borrower’s Stafford Loan.
Interest Subsidy Payments. ED is responsible for paying interest on Subsidized Stafford Loans:
• while the borrower is a qualified student,
• during the grace period, and
• during prescribed deferral periods.
ED makes quarterly interest subsidy payments to the owner of a Subsidized Stafford Loan in an amount
equal to the interest that accrues on the unpaid balance of that loan before repayment begins or during any
deferral periods. The HEA provides that the owner of an eligible Subsidized Stafford Loan has a contractual
right against the United States to receive interest subsidy and Special Allowance Payments.
However, receipt of interest subsidy and special allowance payments is conditioned on compliance with
the requirements of the HEA.
Lenders generally receive interest subsidy and Special Allowance Payments within 45 days to 60 days
after submitting the applicable data for any given calendar quarter to ED. However, there can be no assurance
that payments will, in fact, be received from ED within that period.
If the loan is not held by an eligible lender in accordance with the requirements of the HEA and the
applicable guarantee agreement, the loan may lose its federal assistance.
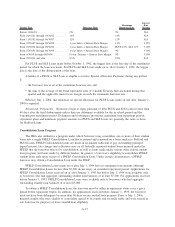
Loan Limits. The HEA generally requires that lenders disburse student loans in at least two equal
disbursements. The HEA limits the amount a student can borrow in any academic year. The following chart
shows loan limits applicable to loans first disbursed on or after July 1, 2008.
Borrower Academic Level
Subsidized and
Unsubsidized
Additional
Unsubsidized
Maximum
Annual Total
Amount
Subsidized and
Unsubsidized
Additional
Unsubsidized
Maximum
Annual Total
Amount
Dependent Student Independent Student
Undergraduate (per year)
1
(st)
year ............. $ 3,500 $2,000 $ 5,500 $ 3,500 $ 6,000 $ 9,500
2
(nd)
year ............. $ 4,500 $2,000 $ 6,500 $ 4,500 $ 6,000 $ 10,500
3
(rd)
year and above ..... $ 5,500 $2,000 $ 7,500 $ 5,500 $ 7,000 $ 12,500
Aggregate Limit ........ $23,000 $8,000 $31,000 $23,000 $34,500 $ 57,500
Graduate (per year) ..... N/A N/A N/A $ 8,500 $12,000 $ 20,500
Aggregate Limit (includes
undergraduate) ......... N/A N/A N/A $65,500 $73,000 $138,500
The following charts show historic loan limits:
Borrower Academic Level
Dependent Student
Subsidized and
Unsubsidized
On or After
07/1/07
Subsidized and
Unsubsidized
On or After
07/1/07
Additional
Unsubsidized
On or After
07/1/07
Maximum Annual
Total Amount
Independent Student
Undergraduate (per year)
1
(st)
year ....................... $ 3,500 $ 3,500 $ 4,000 $ 7,500
2
(nd)
year ....................... $ 4,500 $ 4,500 $ 4,000 $ 8,500
3
(rd)
year and above ............... $ 5,500 $ 5,500 $ 5,000 $ 10,500
Aggregate Limit ................. $23,000 $23,000 $23,000 $ 46,000
Graduate (per year) ................. N/A $ 8,500 $12,000 $ 20,500
Aggregate Limit (includes
undergraduate)................... N/A $65,500 $73,000 $138,500
A-10