Sallie Mae 2010 Annual Report Download - page 148
Download and view the complete annual report
Please find page 148 of the 2010 Sallie Mae annual report below. You can navigate through the pages in the report by either clicking on the pages listed below, or by using the keyword search tool below to find specific information within the annual report.-
 1
1 -
2
-
3
-
4
-
5
-
6
-
7
-
8
-
9
-
10
-
11
-
12
-
13
-
14
-
15
-
16
-
17
-
18
-
19
-
20
-
21
-
22
-
23
-
24
-
25
-
26
-
27
-
28
-
29
-
30
-
31
-
32
-
33
-
34
-
35
-
36
-
37
-
38
-
39
-
40
-
41
-
42
-
43
-
44
-
45
-
46
-
47
-
48
-
49
-
50
-
51
-
52
-
53
-
54
-
55
-
56
-
57
-
58
-
59
-
60
-
61
-
62
-
63
-
64
-
65
-
66
-
67
-
68
-
69
-
70
-
71
-
72
-
73
-
74
-
75
-
76
-
77
-
78
-
79
-
80
-
81
-
82
-
83
-
84
-
85
-
86
-
87
-
88
-
89
-
90
-
91
-
92
-
93
-
94
-
95
-
96
-
97
-
98
-
99
-
100
-
101
-
102
-
103
-
104
-
105
-
106
-
107
-
108
-
109
-
110
-
111
-
112
-
113
-
114
-
115
-
116
-
117
-
118
-
119
-
120
-
121
-
122
-
123
-
124
-
125
-
126
-
127
-
128
-
129
-
130
-
131
-
132
-
133
-
134
-
135
-
136
-
137
-
 138
138 -
 139
139 -
 140
140 -
 141
141 -
 142
142 -
 143
143 -
 144
144 -
 145
145 -
 146
146 -
 147
147 -
 148
148 -
 149
149 -
 150
150 -
 151
151 -
 152
152 -
 153
153 -
 154
154 -
 155
155 -
 156
156 -
 157
157 -
 158
158 -
159
-
160
-
161
-
162
-
163
-
164
-
165
-
166
-
167
-
168
-
169
-
170
-
171
-
172
-
173
-
174
-
175
-
176
-
177
-
178
-
179
-
180
-
181
-
182
-
183
-
184
-
185
-
186
-
187
-
188
-
189
-
190
-
191
-
192
-
193
-
194
-
195
-
196
-
197
-
198
-
199
-
200
-
201
-
202
-
203
-
204
-
205
-
206
-
207
-
208
-
209
-
210
-
211
-
212
-
213
-
214
-
215
-
216
-
217
-
218
-
219
-
220
-
221
-
222
-
223
-
224
-
225
-
226
 |
 |

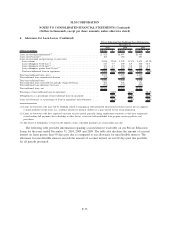
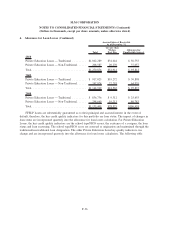
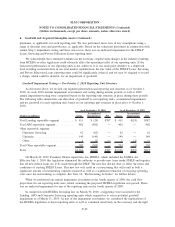
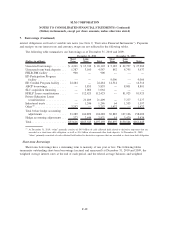
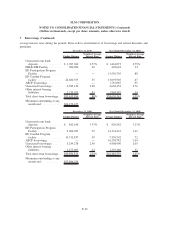
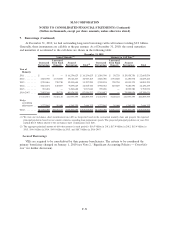
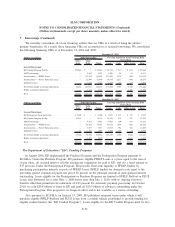
6. Goodwill and Acquired Intangible Assets (Continued)
Resulting discount rates and growth rates used for our reporting units were:
Discount Rate Growth Rate Discount Rate Growth Rate
Third Quarter 2010 Fourth Quarter 2009
Lending
(1)
........................ 13% 0.5% 11% 3%
APG
(2)
.......................... 14% 2.5% 10% 4%
Guarantor Servicing
(2)
............... 13% 0% 10% 0%
Upromise
(2)
....................... 17% 2.5% 15% 4%
(1)
Assumes an equity sale; therefore, the discount rate is used to value the entire reporting unit.
(2)
Assumes an asset sale; therefore, the discount rate is used to value the assets of the reporting unit.
The discount rates are higher than the ones used in the 2009 annual impairment test primarily due to new
information received in the third quarter of 2010 related to implied discount rates of similar transactions that
priced or settled in the third quarter of 2010. In addition, the Dodd-Frank Act, which became law in the third
quarter of 2010, creates uncertainty over particular parts of the business. In addition, the Upromise reporting
unit had a significant reduction in future revenue expectations during the third quarter of 2010 related to
contract negotiations.
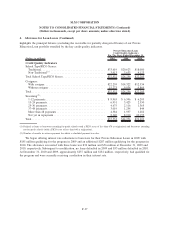
The following table illustrates the carrying value of equity for each reporting unit and the estimated fair
value determined in conjunction with Step 1 impairment testing in the third quarter of 2010.
(Dollars in millions)
Carrying Value
of Equity
Fair Value
of Equity $ Difference % Difference
Lending ........................... $3,530 $6,201 $2,671 76%
APG ............................. 641 405 (236) (36)
Guarantor Servicing .................. 97 91 (6) (6)
Upromise .......................... 221 110 (111) (50)
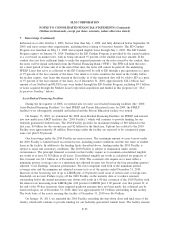
We reviewed and approved the valuation prepared by the appraisal firm for each reporting unit, including
the valuation methods employed and the key assumptions used, such as the discount rates, growth rates and
control premiums, as applicable, for each reporting unit. We also performed stress tests of key assumptions
using a range of discount rates and growth rates, as applicable. Based on the valuations performed in
conjunction with Step 1 impairment testing and these stress tests, there was no indicated impairment for the
Lending reporting unit and there was indicated impairment for the APG, Guarantor Services and Upromise
reporting units in the third quarter testing.
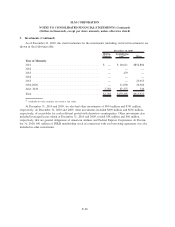
Under the second step of the analysis, determining the implied fair value of goodwill requires valuation
of a reporting unit’s identifiable tangible and intangible assets and liabilities in a manner similar to the
allocation of purchase price in a business combination. If the carrying value of a reporting unit’s goodwill
exceeds its implied fair value, goodwill is deemed impaired and is written down to the extent of the
difference. As a result, we impaired the value of our goodwill by $402 million in our APG reporting unit,
$140 million in our Upromise reporting unit and $62 million in our Guarantor Servicing reporting unit, which
has been recorded as a charge in the third quarter of 2010.
F-45
SLM CORPORATION
NOTES TO CONSOLIDATED FINANCIAL STATEMENTS (Continued)
(Dollars in thousands, except per share amounts, unless otherwise stated)