Sallie Mae 2010 Annual Report Download - page 139
Download and view the complete annual report
Please find page 139 of the 2010 Sallie Mae annual report below. You can navigate through the pages in the report by either clicking on the pages listed below, or by using the keyword search tool below to find specific information within the annual report.-
 1
1 -
2
-
3
-
4
-
5
-
6
-
7
-
8
-
9
-
10
-
11
-
12
-
13
-
14
-
15
-
16
-
17
-
18
-
19
-
20
-
21
-
22
-
23
-
24
-
25
-
26
-
27
-
28
-
29
-
30
-
31
-
32
-
33
-
34
-
35
-
36
-
37
-
38
-
39
-
40
-
41
-
42
-
43
-
44
-
45
-
46
-
47
-
48
-
49
-
50
-
51
-
52
-
53
-
54
-
55
-
56
-
57
-
58
-
59
-
60
-
61
-
62
-
63
-
64
-
65
-
66
-
67
-
68
-
69
-
70
-
71
-
72
-
73
-
74
-
75
-
76
-
77
-
78
-
79
-
80
-
81
-
82
-
83
-
84
-
85
-
86
-
87
-
88
-
89
-
90
-
91
-
92
-
93
-
94
-
95
-
96
-
97
-
98
-
99
-
100
-
101
-
102
-
103
-
104
-
105
-
106
-
107
-
108
-
109
-
110
-
111
-
112
-
113
-
114
-
115
-
116
-
117
-
118
-
119
-
120
-
121
-
122
-
123
-
124
-
125
-
126
-
127
-
128
-
 129
129 -
 130
130 -
 131
131 -
 132
132 -
 133
133 -
 134
134 -
 135
135 -
 136
136 -
 137
137 -
 138
138 -
 139
139 -
 140
140 -
 141
141 -
 142
142 -
 143
143 -
 144
144 -
 145
145 -
 146
146 -
 147
147 -
 148
148 -
 149
149 -
150
-
151
-
152
-
153
-
154
-
155
-
156
-
157
-
158
-
159
-
160
-
161
-
162
-
163
-
164
-
165
-
166
-
167
-
168
-
169
-
170
-
171
-
172
-
173
-
174
-
175
-
176
-
177
-
178
-
179
-
180
-
181
-
182
-
183
-
184
-
185
-
186
-
187
-
188
-
189
-
190
-
191
-
192
-
193
-
194
-
195
-
196
-
197
-
198
-
199
-
200
-
201
-
202
-
203
-
204
-
205
-
206
-
207
-
208
-
209
-
210
-
211
-
212
-
213
-
214
-
215
-
216
-
217
-
218
-
219
-
220
-
221
-
222
-
223
-
224
-
225
-
226
 |
 |

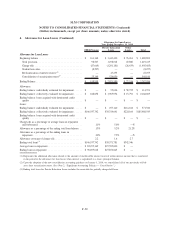
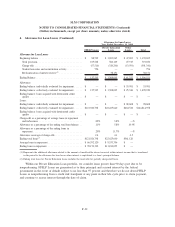
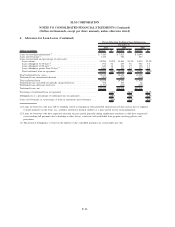
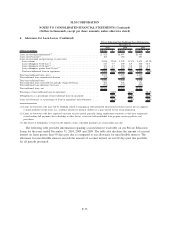
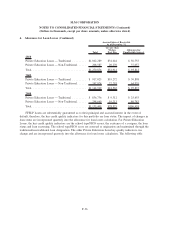
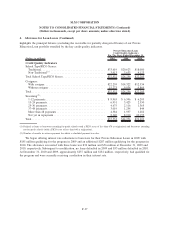
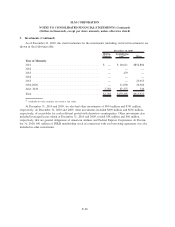
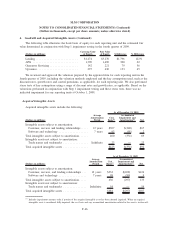
4. Allowance for Loan Losses (Continued)
Total
Greater than
90 days
Past Due
Allowance for
Uncollectible Interest
Accrued Interest Receivable
As of December 31,
2010
Private Education Loans — Traditional ......... $1,062,289 $34,644 $ 56,755
Private Education Loans — Non-Traditional ...... 208,587 20,270 37,057
Total................................... $1,270,876 $54,914 $ 93,812
2009
Private Education Loans — Traditional ......... $ 917,025 $19,272 $ 30,898
Private Education Loans — Non-Traditional ...... 247,924 22,293 64,939
Total................................... $1,164,949 $41,565 $ 95,837
2008
Private Education Loans — Traditional ......... $ 836,736 $ 9,312 $ 25,655
Private Education Loans — Non-Traditional ...... 298,669 19,213 80,783
Total................................... $1,135,405 $28,525 $106,438
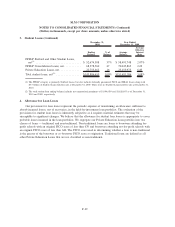
FFELP Loans are substantially guaranteed as to their principal and accrued interest in the event of
default, therefore, the key credit quality indicators for this portfolio are loan status. The impact of changes in
loan status are incorporated quarterly into the allowance for loan losses calculation. For Private Education
Loans, the key credit quality indicators are the school type/FICO scores, the existence of a cosigner, the loan
status and loan seasoning. The school type/FICO score are assessed at origination and maintained through the
traditional/non-traditional loan designation. The other Private Education Loan key quality indicators can
change and are incorporated quarterly into the allowance for loan losses calculation. The following table
F-36
SLM CORPORATION
NOTES TO CONSOLIDATED FINANCIAL STATEMENTS (Continued)
(Dollars in thousands, except per share amounts, unless otherwise stated)