Sallie Mae 2010 Annual Report Download - page 193
Download and view the complete annual report
Please find page 193 of the 2010 Sallie Mae annual report below. You can navigate through the pages in the report by either clicking on the pages listed below, or by using the keyword search tool below to find specific information within the annual report.-
 1
1 -
2
-
3
-
4
-
5
-
6
-
7
-
8
-
9
-
10
-
11
-
12
-
13
-
14
-
15
-
16
-
17
-
18
-
19
-
20
-
21
-
22
-
23
-
24
-
25
-
26
-
27
-
28
-
29
-
30
-
31
-
32
-
33
-
34
-
35
-
36
-
37
-
38
-
39
-
40
-
41
-
42
-
43
-
44
-
45
-
46
-
47
-
48
-
49
-
50
-
51
-
52
-
53
-
54
-
55
-
56
-
57
-
58
-
59
-
60
-
61
-
62
-
63
-
64
-
65
-
66
-
67
-
68
-
69
-
70
-
71
-
72
-
73
-
74
-
75
-
76
-
77
-
78
-
79
-
80
-
81
-
82
-
83
-
84
-
85
-
86
-
87
-
88
-
89
-
90
-
91
-
92
-
93
-
94
-
95
-
96
-
97
-
98
-
99
-
100
-
101
-
102
-
103
-
104
-
105
-
106
-
107
-
108
-
109
-
110
-
111
-
112
-
113
-
114
-
115
-
116
-
117
-
118
-
119
-
120
-
121
-
122
-
123
-
124
-
125
-
126
-
127
-
128
-
129
-
130
-
131
-
132
-
133
-
134
-
135
-
136
-
137
-
138
-
139
-
140
-
141
-
142
-
143
-
144
-
145
-
146
-
147
-
148
-
149
-
150
-
151
-
152
-
153
-
154
-
155
-
156
-
157
-
158
-
159
-
160
-
161
-
162
-
163
-
164
-
165
-
166
-
167
-
168
-
169
-
170
-
171
-
172
-
173
-
174
-
175
-
176
-
177
-
178
-
179
-
180
-
181
-
182
-
 183
183 -
 184
184 -
 185
185 -
 186
186 -
 187
187 -
 188
188 -
 189
189 -
 190
190 -
 191
191 -
 192
192 -
 193
193 -
 194
194 -
 195
195 -
 196
196 -
 197
197 -
 198
198 -
 199
199 -
 200
200 -
 201
201 -
 202
202 -
 203
203 -
204
-
205
-
206
-
207
-
208
-
209
-
210
-
211
-
212
-
213
-
214
-
215
-
216
-
217
-
218
-
219
-
220
-
221
-
222
-
223
-
224
-
225
-
226
 |
 |
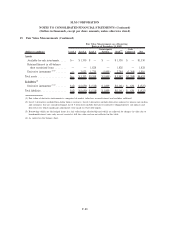
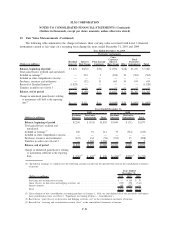
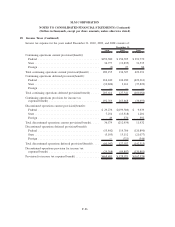
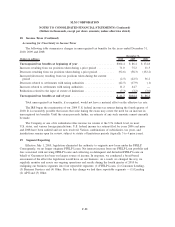
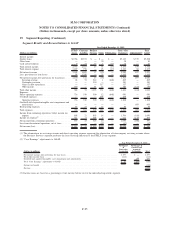
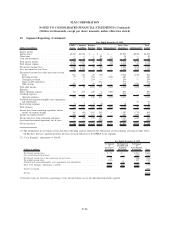
19. Segment Reporting (Continued)
As a result of the change in segment reporting that occurred in the fourth quarter 2010, past periods have
been recast for comparison purposes. In connection with changing the reportable segments the following lists
other significant changes we made related to the new segment presentation:
• The operating expenses reported for each segment are directly attributable to the generation of revenues
by that segment. We have included corporate overhead and certain information technology costs
(together referred to as “Overhead”) in our Other segment rather than allocate those expenses by
segment.
• The creation of the FFELP Loans and Business Services segments has resulted in our accounting for
the significant servicing revenue we earn on FFELP Loans we own in the Business Services segment.
This bifurcates the FFELP interest income between the FFELP Loans and Business Services segment,
with an intercompany servicing fee charge from the Business Services segment. The intercompany
amounts are the contractual rates for encumbered loans within a financing facility or a similar market
rate if the loan is not in a financing facility and accordingly exceed our costs.
• In our GAAP-basis financial presentation we allocated existing goodwill to the new reporting units
within the reportable segments based upon relative fair value. During the fourth quarter 2010, we also
evaluated our goodwill for impairment using both the old reporting and new reporting unit framework
and there was no impairment under either analysis.
• Similar to prior periods, capital is assigned to each segment based on internally determined risk
adjusted weightings for the assets in each segment. These weightings have been updated and differ
depending on the relative risk of each asset type and represent management’s view of the level of
capital needed to support different assets. Unsecured debt is allocated based on the remaining funding
needed for each segment after direct funding and the capital allocation has been considered.
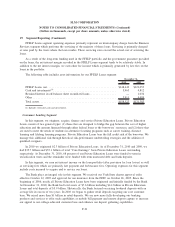
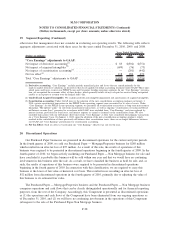
As part of the change in the reportable segments in the fourth quarter of 2010, we also changed our
calculation of “Core Earnings.” When our FFELP Loan portfolio was growing, management and investors in
the Company valued it based on recurring income streams. Given the uncertain and volatile nature of
unhedged Floor Income, little value was attributed to it by the financial markets; therefore we excluded
unhedged Floor Income from “Core Earnings.” Now that our FFELP Loan portfolio is amortizing down,
management and investors are focused on the total amount of cash the FFELP Loan portfolio generates
including unhedged Floor Income. As a result, we now include unhedged Floor Income in “Core Earnings”
and have recast past “Core Earnings” financial results to reflect this change.
The effect of including unhedged Floor Income, net of tax, on “Core Earnings” was an increase of
$21 million, $210 million and $57 million for the years ending December 31, 2010, 2009 and 2008,
respectively.
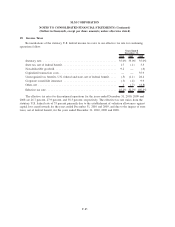
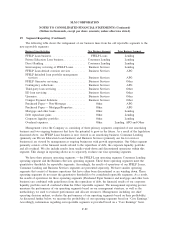
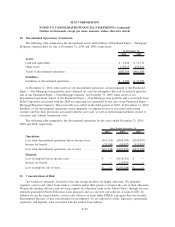
FFELP Loans Segment
Our FFELP Loans segment consists of our FFELP Loan portfolio and the underlying debt and capital
funding the loans. These FFELP Loans are either financed through various types of secured non-recourse
financing vehicles or unsecured debt. At December 31, 2010, we held $148.6 billion of total FFELP Loans, of
which 77 percent were funded to term by securitization trusts, 16 percent were funded through the ED
Conduit Program which terminates on January 19, 2014, 5 percent were funded in our multi-year ABCP
facility and FHLB-DM facility. The remainder was funded with unsecured debt. While we may acquire third-
party FFELP loan portfolios in the future, our existing FFELP Loan portfolio will amortize over approximately
25 years.
F-90
SLM CORPORATION
NOTES TO CONSOLIDATED FINANCIAL STATEMENTS (Continued)
(Dollars in thousands, except per share amounts, unless otherwise stated)