Sallie Mae 2010 Annual Report Download - page 60
Download and view the complete annual report
Please find page 60 of the 2010 Sallie Mae annual report below. You can navigate through the pages in the report by either clicking on the pages listed below, or by using the keyword search tool below to find specific information within the annual report.-
 1
1 -
2
-
3
-
4
-
5
-
6
-
7
-
8
-
9
-
10
-
11
-
12
-
13
-
14
-
15
-
16
-
17
-
18
-
19
-
20
-
21
-
22
-
23
-
24
-
25
-
26
-
27
-
28
-
29
-
30
-
31
-
32
-
33
-
34
-
35
-
36
-
37
-
38
-
39
-
40
-
41
-
42
-
43
-
44
-
45
-
46
-
47
-
48
-
49
-
 50
50 -
 51
51 -
 52
52 -
 53
53 -
 54
54 -
 55
55 -
 56
56 -
 57
57 -
 58
58 -
 59
59 -
 60
60 -
 61
61 -
 62
62 -
 63
63 -
 64
64 -
 65
65 -
 66
66 -
 67
67 -
 68
68 -
 69
69 -
 70
70 -
71
-
72
-
73
-
74
-
75
-
76
-
77
-
78
-
79
-
80
-
81
-
82
-
83
-
84
-
85
-
86
-
87
-
88
-
89
-
90
-
91
-
92
-
93
-
94
-
95
-
96
-
97
-
98
-
99
-
100
-
101
-
102
-
103
-
104
-
105
-
106
-
107
-
108
-
109
-
110
-
111
-
112
-
113
-
114
-
115
-
116
-
117
-
118
-
119
-
120
-
121
-
122
-
123
-
124
-
125
-
126
-
127
-
128
-
129
-
130
-
131
-
132
-
133
-
134
-
135
-
136
-
137
-
138
-
139
-
140
-
141
-
142
-
143
-
144
-
145
-
146
-
147
-
148
-
149
-
150
-
151
-
152
-
153
-
154
-
155
-
156
-
157
-
158
-
159
-
160
-
161
-
162
-
163
-
164
-
165
-
166
-
167
-
168
-
169
-
170
-
171
-
172
-
173
-
174
-
175
-
176
-
177
-
178
-
179
-
180
-
181
-
182
-
183
-
184
-
185
-
186
-
187
-
188
-
189
-
190
-
191
-
192
-
193
-
194
-
195
-
196
-
197
-
198
-
199
-
200
-
201
-
202
-
203
-
204
-
205
-
206
-
207
-
208
-
209
-
210
-
211
-
212
-
213
-
214
-
215
-
216
-
217
-
218
-
219
-
220
-
221
-
222
-
223
-
224
-
225
-
226
 |
 |

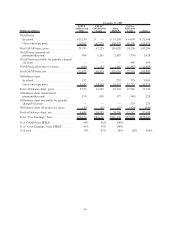
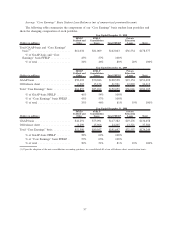
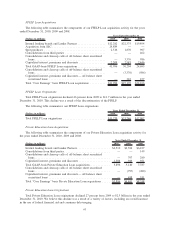
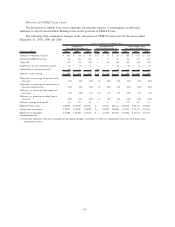
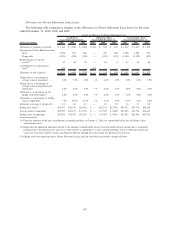
(Dollars in millions)
FFELP
Stafford and
Other
FFELP
Consolidation
Loans
Total
FFELP
Total Private
Education
Loans
Total On-
Balance Sheet
Portfolio
GAAP-Basis
Year Ended December 31, 2009
Beginning balance ................ $52,476 $71,744 $124,220 $20,582 $144,802
Consolidations to third parties...... (1,113) (518) (1,631) (8) (1,639)
Acquisitions and originations
(1)
. . . . . 25,677 1,150 26,827 4,343 31,170
Net acquisitions and originations . . . . . 24,564 632 25,196 4,335 29,531
Securitization-related
(2)
............ 645 — 645 — 645
Sales .......................... (19,300) — (19,300) — (19,300)
Repayments/defaults/resales/other . . . . . (5,710) (3,997) (9,707) (2,164) (11,871)
Ending balance .................. $52,675 $68,379 $121,054 $22,753 $143,807
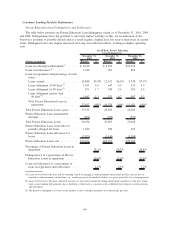
FFELP
Stafford and
Other
FFELP
Consolidation
Loans
Total
FFELP
Total Private
Education
Loans
Total Off-
Balance Sheet
Portfolio
Off-Balance Sheet
Year Ended December 31, 2009
Beginning balance ................. $7,143 $15,531 $22,674 $12,917 $35,591
Consolidations to third parties ...... (413) (138) (551) (18) (569)
Acquisitions and originations
(1)
...... 135 208 343 498 841
Net acquisitions and originations ...... (278) 70 (208) 480 272
Securitization-related
(2)
............. (645) — (645) — (645)
Repayments/defaults/resales/other ...... (720) (804) (1,524) (1,056) (2,580)
Ending balance ................... $5,500 $14,797 $20,297 $12,341 $32,638
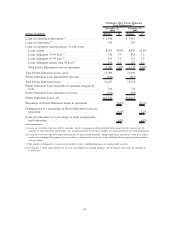
FFELP
Stafford and
Other
FFELP
Consolidation
Loans
Total
FFELP
Total Private
Education
Loans
Total “Core
Earnings” Basis
Portfolio
“Core Earnings” Basis Portfolio
Year Ended December 31, 2009
Beginning balance ............... $59,619 $87,275 $146,894 $33,499 $180,393
Consolidations to third parties . . . . (1,526) (656) (2,182) (26) (2,208)
Acquisitions and originations
(1)
. . . 25,812 1,358 27,170 4,841 32,011
Net acquisitions and originations . . . . 24,286 702 24,988 4,815 29,803
Securitization-related
(2)
........... — — — — —
Sales ......................... (19,300) — (19,300) — (19,300)
Repayments/defaults/resales/other . . . (6,430) (4,801) (11,231) (3,220) (14,451)
Ending balance ................. $58,175 $83,176 $141,351 $35,094 $176,445
(1)
Includes accrued interest receivable capitalized to principal during the period.
(2)
Represents loans within securitization trusts that we are required to consolidate under GAAP once the trusts’ loan balances are below
the clean-up call threshold.
59