Sallie Mae 2010 Annual Report Download - page 93
Download and view the complete annual report
Please find page 93 of the 2010 Sallie Mae annual report below. You can navigate through the pages in the report by either clicking on the pages listed below, or by using the keyword search tool below to find specific information within the annual report.-
 1
1 -
2
-
3
-
4
-
5
-
6
-
7
-
8
-
9
-
10
-
11
-
12
-
13
-
14
-
15
-
16
-
17
-
18
-
19
-
20
-
21
-
22
-
23
-
24
-
25
-
26
-
27
-
28
-
29
-
30
-
31
-
32
-
33
-
34
-
35
-
36
-
37
-
38
-
39
-
40
-
41
-
42
-
43
-
44
-
45
-
46
-
47
-
48
-
49
-
50
-
51
-
52
-
53
-
54
-
55
-
56
-
57
-
58
-
59
-
60
-
61
-
62
-
63
-
64
-
65
-
66
-
67
-
68
-
69
-
70
-
71
-
72
-
73
-
74
-
75
-
76
-
77
-
78
-
79
-
80
-
81
-
82
-
 83
83 -
 84
84 -
 85
85 -
 86
86 -
 87
87 -
 88
88 -
 89
89 -
 90
90 -
 91
91 -
 92
92 -
 93
93 -
 94
94 -
 95
95 -
 96
96 -
 97
97 -
 98
98 -
 99
99 -
 100
100 -
 101
101 -
 102
102 -
 103
103 -
104
-
105
-
106
-
107
-
108
-
109
-
110
-
111
-
112
-
113
-
114
-
115
-
116
-
117
-
118
-
119
-
120
-
121
-
122
-
123
-
124
-
125
-
126
-
127
-
128
-
129
-
130
-
131
-
132
-
133
-
134
-
135
-
136
-
137
-
138
-
139
-
140
-
141
-
142
-
143
-
144
-
145
-
146
-
147
-
148
-
149
-
150
-
151
-
152
-
153
-
154
-
155
-
156
-
157
-
158
-
159
-
160
-
161
-
162
-
163
-
164
-
165
-
166
-
167
-
168
-
169
-
170
-
171
-
172
-
173
-
174
-
175
-
176
-
177
-
178
-
179
-
180
-
181
-
182
-
183
-
184
-
185
-
186
-
187
-
188
-
189
-
190
-
191
-
192
-
193
-
194
-
195
-
196
-
197
-
198
-
199
-
200
-
201
-
202
-
203
-
204
-
205
-
206
-
207
-
208
-
209
-
210
-
211
-
212
-
213
-
214
-
215
-
216
-
217
-
218
-
219
-
220
-
221
-
222
-
223
-
224
-
225
-
226
 |
 |
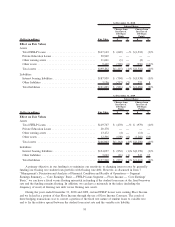
In the preceding tables, under the scenario where interest rates increase 100 and 300 basis points, the
change in pre-tax net income before the unrealized gains (losses) on derivative and hedging activities is
primarily due to the impact of (i) our unhedged on-balance sheet loans being in a fixed-rate mode due to the
Embedded Floor Income, while being funded with variable debt in low interest rate environments; and (ii) a
portion of our variable assets being funded with fixed debt. Item (i) will generally cause income to decrease
when interest rates increase from a low interest rate environment, whereas item (ii) will generally offset this
decrease. In the 100 and 300 basis point scenarios for the year ended December 31, 2010, the increase in
income resulted from item (ii) having a greater impact than item (i). In the prior year period, item (i) resulted
in a decrease to income in the 100 and 300 basis point scenarios.
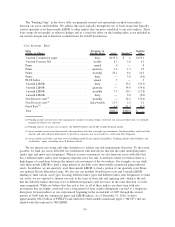
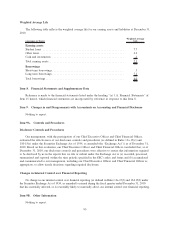
Under the scenario in the tables above labeled “Asset and Funding Index Mismatches,” the main driver of
the decrease in pre-tax income before unrealized gains (losses) on derivative and hedging activities is the result
of LIBOR-based debt funding commercial paper-indexed assets. See “Asset and Liability Funding Gap” of this
Item 7A for a further discussion. Increasing the spread between indices will also impact the unrealized gains
(losses) on derivatives and hedging activities as it relates to basis swaps. Basis swaps used to convert LIBOR-
based debt to indices that we believe are economic hedges of the indices of the assets being funded resulted in
an unrealized losses of $(204) million and $(102) million for the years ended December 31, 2010 and 2009,
respectively. Offsetting this unrealized loss are basis swaps that economically hedge our Private Education
Loan securitization trusts. Unrealized gains for these basis swaps totaled $176 million and $208 million for
the years ended December 31, 2010 and 2009, respectively. The change from a net gain in the prior year
period to a net loss in the current year period was the impact of basis swap hedges in securitization trusts that
were previously off-balance sheet prior to new consolidation accounting adopted on January 1, 2010 (see
Item 7 “Management’s Discussion and Analysis of Financial Condition and Results of Operations — Critical
Accounting Policies and Estimates — Transfers of Financial Assets and the VIE Consolidation Model” for
further discussion).
In addition to interest rate risk addressed in the preceding tables, we are also exposed to risks related to
foreign currency exchange rates. Foreign currency exchange risk is primarily the result of foreign currency
denominated debt issued by us. As it relates to our corporate unsecured and securitization debt programs used to
fund our business, our policy is to use cross currency interest rate swaps to swap all foreign currency
denominated debt payments (fixed and floating) to U.S. dollar LIBOR using a fixed exchange rate. In the tables
above, there would be an immaterial impact on earnings if exchange rates were to decrease or increase, due to
the terms of the hedging instrument and hedged items matching. The balance sheet interest bearing liabilities
would be affected by a change in exchange rates; however, the change would be materially offset by the cross
currency interest rate swaps in other assets or other liabilities. In the current economic environment, volatility in
the spread between spot and forward foreign exchange rates has resulted in material mark-to-market impacts to
current-period earnings which have not been factored into the above analysis. The earnings impact is noncash,
and at maturity of the instruments the cumulative mark-to-market impact will be zero.
92