Sallie Mae 2010 Annual Report Download - page 178
Download and view the complete annual report
Please find page 178 of the 2010 Sallie Mae annual report below. You can navigate through the pages in the report by either clicking on the pages listed below, or by using the keyword search tool below to find specific information within the annual report.-
 1
1 -
2
-
3
-
4
-
5
-
6
-
7
-
8
-
9
-
10
-
11
-
12
-
13
-
14
-
15
-
16
-
17
-
18
-
19
-
20
-
21
-
22
-
23
-
24
-
25
-
26
-
27
-
28
-
29
-
30
-
31
-
32
-
33
-
34
-
35
-
36
-
37
-
38
-
39
-
40
-
41
-
42
-
43
-
44
-
45
-
46
-
47
-
48
-
49
-
50
-
51
-
52
-
53
-
54
-
55
-
56
-
57
-
58
-
59
-
60
-
61
-
62
-
63
-
64
-
65
-
66
-
67
-
68
-
69
-
70
-
71
-
72
-
73
-
74
-
75
-
76
-
77
-
78
-
79
-
80
-
81
-
82
-
83
-
84
-
85
-
86
-
87
-
88
-
89
-
90
-
91
-
92
-
93
-
94
-
95
-
96
-
97
-
98
-
99
-
100
-
101
-
102
-
103
-
104
-
105
-
106
-
107
-
108
-
109
-
110
-
111
-
112
-
113
-
114
-
115
-
116
-
117
-
118
-
119
-
120
-
121
-
122
-
123
-
124
-
125
-
126
-
127
-
128
-
129
-
130
-
131
-
132
-
133
-
134
-
135
-
136
-
137
-
138
-
139
-
140
-
141
-
142
-
143
-
144
-
145
-
146
-
147
-
148
-
149
-
150
-
151
-
152
-
153
-
154
-
155
-
156
-
157
-
158
-
159
-
160
-
161
-
162
-
163
-
164
-
165
-
166
-
167
-
 168
168 -
 169
169 -
 170
170 -
 171
171 -
 172
172 -
 173
173 -
 174
174 -
 175
175 -
 176
176 -
 177
177 -
 178
178 -
 179
179 -
 180
180 -
 181
181 -
 182
182 -
 183
183 -
 184
184 -
 185
185 -
 186
186 -
 187
187 -
 188
188 -
189
-
190
-
191
-
192
-
193
-
194
-
195
-
196
-
197
-
198
-
199
-
200
-
201
-
202
-
203
-
204
-
205
-
206
-
207
-
208
-
209
-
210
-
211
-
212
-
213
-
214
-
215
-
216
-
217
-
218
-
219
-
220
-
221
-
222
-
223
-
224
-
225
-
226
 |
 |

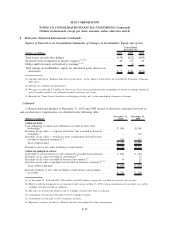
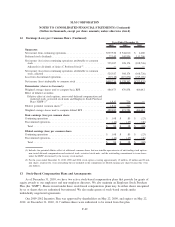
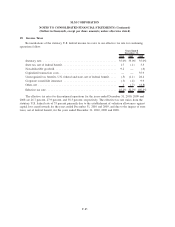
14. Restructuring Activities (Continued)
The following table summarizes the restructuring liability balance, which is included in other liabilities in
the accompanying consolidated balance sheet.
Severance
Costs
Lease and
Other
Contract
Termination
Costs
Exit and
Other Costs Total
Balance at December 31, 2008 ............. $15,124 $ 2,798 $ 60 $ 17,982
Net accruals from continuing operations ....... 8,402 597 1,572 10,571
Net accruals from discontinued operations ...... 9,356 2,193 109 11,658
Cash paid . . . ........................... (23,687) (1,807) (1,741) (27,235)
Balance at December 31, 2009 ............. $ 9,195 $ 3,781 $ — $ 12,976
Net accruals from continuing operations ....... 80,536 1,430 3,270 85,236
Net accruals from discontinued operations ...... 3,108 2,384 70 5,562
Cash paid . . . ........................... (45,235) (3,440) (1,678) (50,353)
Balance at December 31, 2010 ............. $47,604 $ 4,155 $ 1,662 $ 53,421
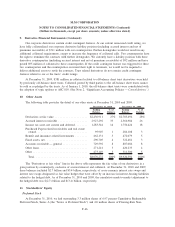
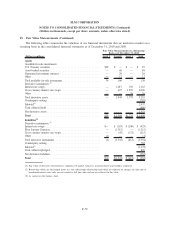
15. Fair Value Measurements
We use estimates of fair value in applying various accounting standards for our financial statements.
We categorize our fair value estimates based on a hierarchical framework associated with three levels of
price transparency utilized in measuring financial instruments at fair value. For additional information
regarding our policies for determining fair value and the hierarchical framework see Note 2, “Significant
Accounting Policies — Fair Value Measurement.”
During the year ended December 31, 2010, there were no significant transfers of financial instruments
between levels.
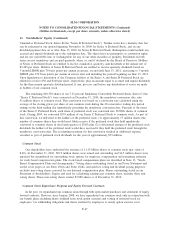
Student Loans
Our FFELP Loans and Private Education Loans are accounted for at cost or at the lower of cost or
market if the loan is held-for-sale. FFELP Loans classified as held-for-sale are those which we have the ability
and intent to sell under various ED loan purchase programs. In these instances, the FFELP Loans are valued
using the committed sales price under the programs. For all other FFELP Loans and Private Education Loans,
fair values were determined by modeling loan cash flows using stated terms of the assets and internally-
developed assumptions to determine aggregate portfolio yield, net present value and average life. The
significant assumptions used to project cash flows are prepayment speeds, default rates, cost of funds, required
return on equity, and expected Repayment Borrower Benefits to be earned. In addition, the Floor Income
component of our FFELP Loan portfolio is valued with option models using both observable market inputs
and internally developed inputs. A number of significant inputs into the models are internally derived and not
observable to market participants. Certain model assumptions were calibrated based upon pricing information
related to our acquisition of the Student Loan Corporation FFELP trusts on December 31, 2010.
Other Loans
Facilities financings, and mortgage and consumer loans held for investment are accounted for at cost with
fair values being disclosed. Fair value was determined primarily by looking to the value of the underlying
F-75
SLM CORPORATION
NOTES TO CONSOLIDATED FINANCIAL STATEMENTS (Continued)
(Dollars in thousands, except per share amounts, unless otherwise stated)