Sallie Mae 2010 Annual Report Download - page 48
Download and view the complete annual report
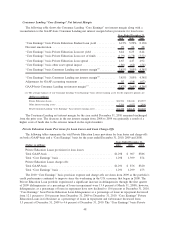
Please find page 48 of the 2010 Sallie Mae annual report below. You can navigate through the pages in the report by either clicking on the pages listed below, or by using the keyword search tool below to find specific information within the annual report.-
 1
1 -
2
-
3
-
4
-
5
-
6
-
7
-
8
-
9
-
10
-
11
-
12
-
13
-
14
-
15
-
16
-
17
-
18
-
19
-
20
-
21
-
22
-
23
-
24
-
25
-
26
-
27
-
28
-
29
-
30
-
31
-
32
-
33
-
34
-
35
-
36
-
37
-
 38
38 -
 39
39 -
 40
40 -
 41
41 -
 42
42 -
 43
43 -
 44
44 -
 45
45 -
 46
46 -
 47
47 -
 48
48 -
 49
49 -
 50
50 -
 51
51 -
 52
52 -
 53
53 -
 54
54 -
 55
55 -
 56
56 -
 57
57 -
 58
58 -
59
-
60
-
61
-
62
-
63
-
64
-
65
-
66
-
67
-
68
-
69
-
70
-
71
-
72
-
73
-
74
-
75
-
76
-
77
-
78
-
79
-
80
-
81
-
82
-
83
-
84
-
85
-
86
-
87
-
88
-
89
-
90
-
91
-
92
-
93
-
94
-
95
-
96
-
97
-
98
-
99
-
100
-
101
-
102
-
103
-
104
-
105
-
106
-
107
-
108
-
109
-
110
-
111
-
112
-
113
-
114
-
115
-
116
-
117
-
118
-
119
-
120
-
121
-
122
-
123
-
124
-
125
-
126
-
127
-
128
-
129
-
130
-
131
-
132
-
133
-
134
-
135
-
136
-
137
-
138
-
139
-
140
-
141
-
142
-
143
-
144
-
145
-
146
-
147
-
148
-
149
-
150
-
151
-
152
-
153
-
154
-
155
-
156
-
157
-
158
-
159
-
160
-
161
-
162
-
163
-
164
-
165
-
166
-
167
-
168
-
169
-
170
-
171
-
172
-
173
-
174
-
175
-
176
-
177
-
178
-
179
-
180
-
181
-
182
-
183
-
184
-
185
-
186
-
187
-
188
-
189
-
190
-
191
-
192
-
193
-
194
-
195
-
196
-
197
-
198
-
199
-
200
-
201
-
202
-
203
-
204
-
205
-
206
-
207
-
208
-
209
-
210
-
211
-
212
-
213
-
214
-
215
-
216
-
217
-
218
-
219
-
220
-
221
-
222
-
223
-
224
-
225
-
226
 |
 |

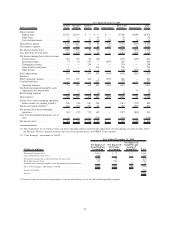
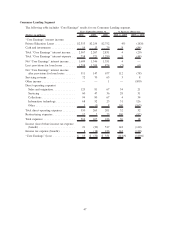
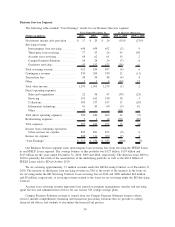
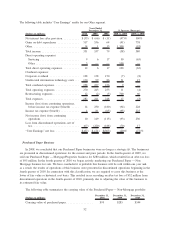
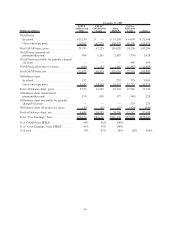
Consumer Lending Segment
The following table includes “Core Earnings” results for our Consumer Lending segment.
(Dollars in millions) 2010 2009 2008 2010 vs. 2009 2009 vs. 2008
Years Ended December 31, % Increase (Decrease)
“Core Earnings” interest income:
Private Education Loans ............. $2,353 $2,254 $2,752 4% (18)%
Cash and investments ............... 14 13 79 8 (84)
Total “Core Earnings” interest income . . . 2,367 2,267 2,831 4 (20)
Total “Core Earnings” interest expense . . 758 721 1,280 5 (44)
Net “Core Earnings” interest income .... 1,609 1,546 1,551 4 —
Less: provisions for loan losses . ....... 1,298 1,399 874 (7) 60
Net “Core Earnings” interest income
after provisions for loan losses ...... 311 147 677 112 (78)
Servicing revenue .................. 72 70 65 3 8
Other income ..................... — — 1 — (100)
Direct operating expenses:
Sales and origination.............. 125 81 67 54 21
Servicing ...................... 60 47 36 28 31
Collections ..................... 94 90 67 4 34
Information technology ............ 68 52 23 31 126
Other ......................... 3 (5) 8 160 (163)
Total direct operating expenses . ....... 350 265 201 32 32
Restructuring expenses .............. 12 2 25 500 (92)
Total expenses .................... 362 267 226 36 18
Income (loss) before income tax expense
(benefit) ....................... 21 (50) 517 142 (110)
Income tax expense (benefit) . . ....... 8 (18) 186 144 (110)
“Core Earnings” (loss) .............. $ 13 $ (32) $ 331 (141)% (110)%
47