Sallie Mae 2010 Annual Report Download - page 28
Download and view the complete annual report
Please find page 28 of the 2010 Sallie Mae annual report below. You can navigate through the pages in the report by either clicking on the pages listed below, or by using the keyword search tool below to find specific information within the annual report.-
 1
1 -
2
-
3
-
4
-
5
-
6
-
7
-
8
-
9
-
10
-
11
-
12
-
13
-
14
-
15
-
16
-
17
-
 18
18 -
 19
19 -
 20
20 -
 21
21 -
 22
22 -
 23
23 -
 24
24 -
 25
25 -
 26
26 -
 27
27 -
 28
28 -
 29
29 -
 30
30 -
 31
31 -
 32
32 -
 33
33 -
 34
34 -
 35
35 -
 36
36 -
 37
37 -
 38
38 -
39
-
40
-
41
-
42
-
43
-
44
-
45
-
46
-
47
-
48
-
49
-
50
-
51
-
52
-
53
-
54
-
55
-
56
-
57
-
58
-
59
-
60
-
61
-
62
-
63
-
64
-
65
-
66
-
67
-
68
-
69
-
70
-
71
-
72
-
73
-
74
-
75
-
76
-
77
-
78
-
79
-
80
-
81
-
82
-
83
-
84
-
85
-
86
-
87
-
88
-
89
-
90
-
91
-
92
-
93
-
94
-
95
-
96
-
97
-
98
-
99
-
100
-
101
-
102
-
103
-
104
-
105
-
106
-
107
-
108
-
109
-
110
-
111
-
112
-
113
-
114
-
115
-
116
-
117
-
118
-
119
-
120
-
121
-
122
-
123
-
124
-
125
-
126
-
127
-
128
-
129
-
130
-
131
-
132
-
133
-
134
-
135
-
136
-
137
-
138
-
139
-
140
-
141
-
142
-
143
-
144
-
145
-
146
-
147
-
148
-
149
-
150
-
151
-
152
-
153
-
154
-
155
-
156
-
157
-
158
-
159
-
160
-
161
-
162
-
163
-
164
-
165
-
166
-
167
-
168
-
169
-
170
-
171
-
172
-
173
-
174
-
175
-
176
-
177
-
178
-
179
-
180
-
181
-
182
-
183
-
184
-
185
-
186
-
187
-
188
-
189
-
190
-
191
-
192
-
193
-
194
-
195
-
196
-
197
-
198
-
199
-
200
-
201
-
202
-
203
-
204
-
205
-
206
-
207
-
208
-
209
-
210
-
211
-
212
-
213
-
214
-
215
-
216
-
217
-
218
-
219
-
220
-
221
-
222
-
223
-
224
-
225
-
226
 |
 |
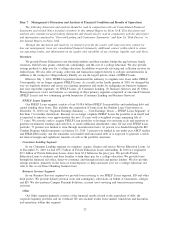
• At the end of the year, our FFELP Loan portfolio was 93 percent funded to term with long-term liabilities
including the ED-sponsored Straight A conduit. We also completed $2 billion of FFELP Loan asset-
backed securitization transactions in 2010. The net interest margin in our FFELP Loans segment improved
to 93 basis points in 2010 from 67 basis points in 2009 as the CP/LIBOR spread returned to historical
levels. In addition, we sold $20.4 billion of loans to ED in 2010 resulting in gains of $321 million.
• In our Private Education Loan portfolio, delinquencies greater than 90 days trended lower throughout
the year to 5.3 percent of loans in repayment at year-end compared to 6.4 percent of loans in repayment
at the end of the first quarter of the year. The quarterly provision for loan losses ended the year at
$294 million, down from the second-quarter 2010 peak of $349 million. Private Education Loan
originations improved over the course of 2010 as well. After falling more than 40 percent in each of
the first two quarters of the year compared with the year-ago quarters they fell just 6 percent in the
third quarter and increased 8 percent in the fourth quarter. We completed $4.1 billion of Private
Education Loan asset-backed securitization transactions in 2010. The Consumer Lending segment
returned to profitability in 2010 after posting a loss in the prior year.
In our Business Services segment, we saw increased revenue in our third-party servicing, contingency
collections and account asset servicing lines of business. We decided to discontinue our Purchased Paper
collection business at the end of 2010.
In response to the elimination of FFELP, in 2010 we expanded an ongoing operating expense reduction
initiative, including closing our Florida and Texas servicing centers and relocating our headquarters to Newark,
Delaware by March 31, 2011.
“Core Earnings” improved significantly to $1 billion from $807 million in the prior year. This was due to
a number of factors including lower provision for loan losses, and a higher net interest margin. In 2010 we
issued $1.5 billion of 10-year unsecured debt and repurchased $4.9 billion of unsecured debt. Combined with
our asset-backed securitization transactions, these actions significantly improved the overall maturity profile of
our outstanding debt.
2011 Outlook
We do not expect the economic environment to improve significantly in 2011. A high unemployment rate
is expected to result in a challenging environment for financial services companies such as ours. We expect
our “Core Earnings” business results to improve principally due to the significant improvement in the quality
of our Private Education Loan portfolio. Increases in the cost of attaining a higher education and enrollments
should drive increased volume in our consumer lending, servicing and collection businesses. “Core Earnings”
are expected to be lower in 2011 than in 2010; however, this is principally due to a sharp decline in gains on
debt repurchases and the absence of revenue generated from the sale of FFELP Loans to ED.
In 2008 we significantly tightened our underwriting criteria and exited certain lending segments. In
addition, each successive repayment cohort, i.e., a group of loans that enter their initial repayment status in the
same calendar year upon exiting their grace period following graduation/separation from school, has been of
higher quality. In 2009 we began to offer Smart Option Student Loans, which require students to make interest
payments while they are in school, a departure from past practices where all required payments were deferred
until the student graduated. In 2010, we began offering the Fixed Pay repayment option, which requires a
payment during school that is less than a full interest payment. The loans that entered repayment in the fourth
quarter of 2010 will influence delinquency trends in the first half of 2011 and charge-offs in the second half.
This cohort of loans is significantly smaller and of higher quality than previous repay cohorts, it has a higher
average credit score and is comprised of significantly smaller amounts of higher risk non-traditional and non-
cosigned loans on a percentage basis and in total volume.
On January 11, 2011 we issued $2 billion, five-year 6.25 percent fixed rate unsecured notes. The rate on
the notes was swapped from a fixed rate to a floating rate equal to an all-in cost of one month LIBOR plus
4.46 percent. Investor demand was the highest ever for a Sallie Mae issue, which we believe reflects investors’
views that our financial condition has strengthened. In 2011, we expect to access the unsecured debt market
27