Sallie Mae 2010 Annual Report Download - page 78
Download and view the complete annual report
Please find page 78 of the 2010 Sallie Mae annual report below. You can navigate through the pages in the report by either clicking on the pages listed below, or by using the keyword search tool below to find specific information within the annual report.-
 1
1 -
2
-
3
-
4
-
5
-
6
-
7
-
8
-
9
-
10
-
11
-
12
-
13
-
14
-
15
-
16
-
17
-
18
-
19
-
20
-
21
-
22
-
23
-
24
-
25
-
26
-
27
-
28
-
29
-
30
-
31
-
32
-
33
-
34
-
35
-
36
-
37
-
38
-
39
-
40
-
41
-
42
-
43
-
44
-
45
-
46
-
47
-
48
-
49
-
50
-
51
-
52
-
53
-
54
-
55
-
56
-
57
-
58
-
59
-
60
-
61
-
62
-
63
-
64
-
65
-
66
-
67
-
 68
68 -
 69
69 -
 70
70 -
 71
71 -
 72
72 -
 73
73 -
 74
74 -
 75
75 -
 76
76 -
 77
77 -
 78
78 -
 79
79 -
 80
80 -
 81
81 -
 82
82 -
 83
83 -
 84
84 -
 85
85 -
 86
86 -
 87
87 -
 88
88 -
89
-
90
-
91
-
92
-
93
-
94
-
95
-
96
-
97
-
98
-
99
-
100
-
101
-
102
-
103
-
104
-
105
-
106
-
107
-
108
-
109
-
110
-
111
-
112
-
113
-
114
-
115
-
116
-
117
-
118
-
119
-
120
-
121
-
122
-
123
-
124
-
125
-
126
-
127
-
128
-
129
-
130
-
131
-
132
-
133
-
134
-
135
-
136
-
137
-
138
-
139
-
140
-
141
-
142
-
143
-
144
-
145
-
146
-
147
-
148
-
149
-
150
-
151
-
152
-
153
-
154
-
155
-
156
-
157
-
158
-
159
-
160
-
161
-
162
-
163
-
164
-
165
-
166
-
167
-
168
-
169
-
170
-
171
-
172
-
173
-
174
-
175
-
176
-
177
-
178
-
179
-
180
-
181
-
182
-
183
-
184
-
185
-
186
-
187
-
188
-
189
-
190
-
191
-
192
-
193
-
194
-
195
-
196
-
197
-
198
-
199
-
200
-
201
-
202
-
203
-
204
-
205
-
206
-
207
-
208
-
209
-
210
-
211
-
212
-
213
-
214
-
215
-
216
-
217
-
218
-
219
-
220
-
221
-
222
-
223
-
224
-
225
-
226
 |
 |

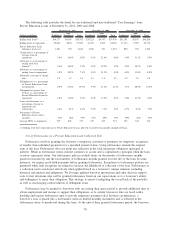
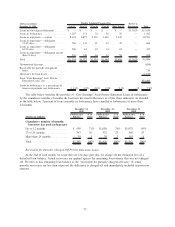
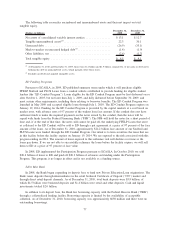
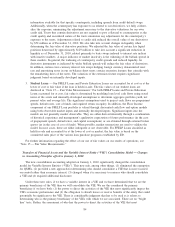
The following table reconciles encumbered and unencumbered assets and their net impact on total
tangible equity.
(Dollars in billions)
December 31,
2010
December 31,
2009
Net assets of consolidated variable interest entities ................ $13.1 $ 12.7
Tangible unencumbered assets
(2)
.............................. 22.3 30.1
Unsecured debt .......................................... (26.9) (35.1)
Mark-to-market on unsecured hedged debt
(1)
..................... (1.4) (1.9)
Other liabilities, net ....................................... (2.6) (1.7)
Total tangible equity ...................................... $ 4.5 $ 4.1
(1)
At December 31, 2010 and December 31, 2009, there were $1.4 billion and $1.9 billion, respectively, of net gains on derivatives
hedging this debt in unencumbered assets, which partially offset these losses.
(2)
Excludes goodwill and acquired intangible assets.
ED Funding Programs
Pursuant to ECASLA, in 2009, ED published summary terms under which it will purchase eligible
FFELP Stafford and PLUS Loans from a conduit vehicle established to provide funding for eligible student
lenders (the “ED Conduit Program”). Loans eligible for the ED Conduit Program must be first disbursed on or
after October 1, 2003, but not later than July 1, 2009, and fully disbursed before September 30, 2009, and
meet certain other requirements, including those relating to borrower benefits. The ED Conduit Program was
launched in May 2009 and accepted eligible loans through July 1, 2010. The ED Conduit Program expires on
January 19, 2014. Funding for the ED Conduit Program is provided by the capital markets at a cost based on
market rates, with advance rates of 97 percent of the student loan face amount. If the conduit does not have
sufficient funds to make the required payments on the notes issued by the conduit, then the notes will be
repaid with funds from the Federal Financing Bank (“FFB”). The FFB will hold the notes for a short period of
time and, if at the end of that time, the notes still cannot be paid off, the underlying FFELP Loans that serve
as collateral to the ED Conduit will be sold to ED through a put agreement at a price of 97 percent of the face
amount of the loans. As of December 31, 2010, approximately $24.2 billion face amount of our Stafford and
PLUS Loans were funded through the ED Conduit Program. Our intent is to term securitize the loans that are
in this facility before the facility expires on January 19, 2014. We are exposed to the risk associated with this
program ending in 2014. The amount of loans exposed to this refinance risk will decline over time as the
loans pay down. If we are not able to successfully refinance the loans before the facility expires, we will sell
them to ED at a price of 97 percent of face value.
In 2008, ED implemented the Participation Program pursuant to ECASLA. In October 2010, we sold
$20.4 billion of loans to ED and paid off $20.3 billion of advances outstanding under the Participation
Program. This program is no longer in effect and is not available as a funding source.
Sallie Mae Bank
In 2008, the Bank began expanding its deposit base to fund new Private Education Loan originations. The
Bank raises deposits through intermediaries in the retail brokered Certificate of Deposit (“CD”) market and
through direct retail deposit channels. As of December 31, 2010, total bank deposits were $5.9 billion, of
which $4.5 billion were brokered deposits and $1.4 billion were retail and other deposits. Cash and liquid
investments totaled $2.0 billion.
In addition to its deposit base, the Bank has borrowing capacity with the Federal Reserve Bank (“FRB”)
through a collateralized lending facility. Borrowing capacity is limited by the availability of acceptable
collateral. As of December 31, 2010, borrowing capacity was approximately $650 million and there were no
outstanding borrowings.
77