Sallie Mae 2010 Annual Report Download - page 132
Download and view the complete annual report
Please find page 132 of the 2010 Sallie Mae annual report below. You can navigate through the pages in the report by either clicking on the pages listed below, or by using the keyword search tool below to find specific information within the annual report.-
 1
1 -
2
-
3
-
4
-
5
-
6
-
7
-
8
-
9
-
10
-
11
-
12
-
13
-
14
-
15
-
16
-
17
-
18
-
19
-
20
-
21
-
22
-
23
-
24
-
25
-
26
-
27
-
28
-
29
-
30
-
31
-
32
-
33
-
34
-
35
-
36
-
37
-
38
-
39
-
40
-
41
-
42
-
43
-
44
-
45
-
46
-
47
-
48
-
49
-
50
-
51
-
52
-
53
-
54
-
55
-
56
-
57
-
58
-
59
-
60
-
61
-
62
-
63
-
64
-
65
-
66
-
67
-
68
-
69
-
70
-
71
-
72
-
73
-
74
-
75
-
76
-
77
-
78
-
79
-
80
-
81
-
82
-
83
-
84
-
85
-
86
-
87
-
88
-
89
-
90
-
91
-
92
-
93
-
94
-
95
-
96
-
97
-
98
-
99
-
100
-
101
-
102
-
103
-
104
-
105
-
106
-
107
-
108
-
109
-
110
-
111
-
112
-
113
-
114
-
115
-
116
-
117
-
118
-
119
-
120
-
121
-
 122
122 -
 123
123 -
 124
124 -
 125
125 -
 126
126 -
 127
127 -
 128
128 -
 129
129 -
 130
130 -
 131
131 -
 132
132 -
 133
133 -
 134
134 -
 135
135 -
 136
136 -
 137
137 -
 138
138 -
 139
139 -
 140
140 -
 141
141 -
 142
142 -
143
-
144
-
145
-
146
-
147
-
148
-
149
-
150
-
151
-
152
-
153
-
154
-
155
-
156
-
157
-
158
-
159
-
160
-
161
-
162
-
163
-
164
-
165
-
166
-
167
-
168
-
169
-
170
-
171
-
172
-
173
-
174
-
175
-
176
-
177
-
178
-
179
-
180
-
181
-
182
-
183
-
184
-
185
-
186
-
187
-
188
-
189
-
190
-
191
-
192
-
193
-
194
-
195
-
196
-
197
-
198
-
199
-
200
-
201
-
202
-
203
-
204
-
205
-
206
-
207
-
208
-
209
-
210
-
211
-
212
-
213
-
214
-
215
-
216
-
217
-
218
-
219
-
220
-
221
-
222
-
223
-
224
-
225
-
226
 |
 |

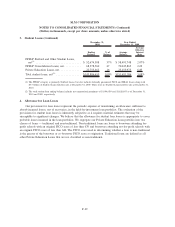
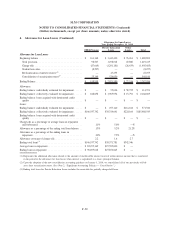
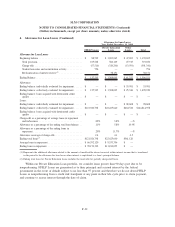
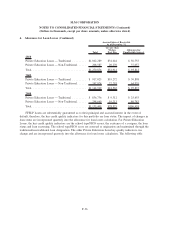
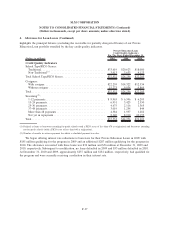
3. Student Loans (Continued)
Ending
Balance
%of
Balance
Average
Balance
Average
Effective
Interest
Rate
December 31,
2009
Year Ended
December 31, 2009
FFELP Stafford and Other Student Loans,
net
(1)
............................. $ 52,674,588 37% $ 58,491,748 2.07%
FFELP Consolidation Loans, net ........... 68,378,560 47 70,045,863 2.69
Private Education Loans, net .............. 22,753,462 16 23,153,975 6.83
Total student loans, net
(2)
................ $143,806,610 100% $151,691,586 3.08%
(1) The FFELP category is primarily Stafford Loans, but also includes federally guaranteed PLUS and HEAL Loans along with
$9.7 billion of Stafford Loans held-for-sale at December 31, 2009. There were no Stafford Loans held-for-sale at December 31,
2010.
(2) The total student loan ending balance includes net unamortized premiums of $1,006,039 and $1,628,693 as of December 31,
2010 and 2009, respectively.
4. Allowance for Loan Losses
Our provisions for loan losses represent the periodic expense of maintaining an allowance sufficient to
absorb incurred losses, net of recoveries, in the held-for-investment loan portfolios. The evaluation of the
provisions for student loan losses is inherently subjective as it requires material estimates that may be
susceptible to significant changes. We believe that the allowance for student loan losses is appropriate to cover
probable losses incurred in the loan portfolios. We segregate our Private Education Loan portfolio into two
classes of loans — traditional and non-traditional. Non-traditional loans are loans to borrowers attending for-
profit schools with an original FICO score of less than 670 and borrowers attending not-for-profit schools with
an original FICO score of less than 640. The FICO score used in determining whether a loan is non-traditional
is the greater of the borrower or co-borrower FICO score at origination. Traditional loans are defined as all
other Private Education Loans that are not classified as non-traditional.
F-29
SLM CORPORATION
NOTES TO CONSOLIDATED FINANCIAL STATEMENTS (Continued)
(Dollars in thousands, except per share amounts, unless otherwise stated)