Sallie Mae 2010 Annual Report Download - page 199
Download and view the complete annual report
Please find page 199 of the 2010 Sallie Mae annual report below. You can navigate through the pages in the report by either clicking on the pages listed below, or by using the keyword search tool below to find specific information within the annual report.-
 1
1 -
2
-
3
-
4
-
5
-
6
-
7
-
8
-
9
-
10
-
11
-
12
-
13
-
14
-
15
-
16
-
17
-
18
-
19
-
20
-
21
-
22
-
23
-
24
-
25
-
26
-
27
-
28
-
29
-
30
-
31
-
32
-
33
-
34
-
35
-
36
-
37
-
38
-
39
-
40
-
41
-
42
-
43
-
44
-
45
-
46
-
47
-
48
-
49
-
50
-
51
-
52
-
53
-
54
-
55
-
56
-
57
-
58
-
59
-
60
-
61
-
62
-
63
-
64
-
65
-
66
-
67
-
68
-
69
-
70
-
71
-
72
-
73
-
74
-
75
-
76
-
77
-
78
-
79
-
80
-
81
-
82
-
83
-
84
-
85
-
86
-
87
-
88
-
89
-
90
-
91
-
92
-
93
-
94
-
95
-
96
-
97
-
98
-
99
-
100
-
101
-
102
-
103
-
104
-
105
-
106
-
107
-
108
-
109
-
110
-
111
-
112
-
113
-
114
-
115
-
116
-
117
-
118
-
119
-
120
-
121
-
122
-
123
-
124
-
125
-
126
-
127
-
128
-
129
-
130
-
131
-
132
-
133
-
134
-
135
-
136
-
137
-
138
-
139
-
140
-
141
-
142
-
143
-
144
-
145
-
146
-
147
-
148
-
149
-
150
-
151
-
152
-
153
-
154
-
155
-
156
-
157
-
158
-
159
-
160
-
161
-
162
-
163
-
164
-
165
-
166
-
167
-
168
-
169
-
170
-
171
-
172
-
173
-
174
-
175
-
176
-
177
-
178
-
179
-
180
-
181
-
182
-
183
-
184
-
185
-
186
-
187
-
188
-
 189
189 -
 190
190 -
 191
191 -
 192
192 -
 193
193 -
 194
194 -
 195
195 -
 196
196 -
 197
197 -
 198
198 -
 199
199 -
 200
200 -
 201
201 -
 202
202 -
 203
203 -
 204
204 -
 205
205 -
 206
206 -
 207
207 -
 208
208 -
 209
209 -
210
-
211
-
212
-
213
-
214
-
215
-
216
-
217
-
218
-
219
-
220
-
221
-
222
-
223
-
224
-
225
-
226
 |
 |

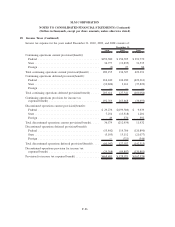
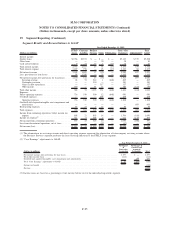
19. Segment Reporting (Continued)
(Dollars in millions)
FFELP
Loans
Consumer
Lending
Business
Services Other Eliminations
(1)
Total “Core
Earnings” Adjustments
(2)
Total
GAAP
Year Ended December 31, 2009
Interest income:
Student loans .......................... $3,252 $2,254 $ — $ — $ — $5,506 $(830) $4,676
Other loans ........................... — — — 56 — 56 — 56
Cash and investments ..................... 26 13 20 (10) (20) 29 (3) 26
Total interest income ..................... 3,278 2,267 20 46 (20) 5,591 (833) 4,758
Total interest expense ..................... 2,238 721 — 66 (20) 3,005 30 3,035
Net interest income (loss) .................. 1,040 1,546 20 (20) — 2,586 (863) 1,723
Less: provisions for loan losses ............... 119 1,399 — 46 — 1,564 (445) 1,119
Net interest income (loss) after provisions for loan
losses ............................. 921 147 20 (66) — 1,022 (418) 604
Servicing revenue ...................... 75 70 954 — (659) 440 — 440
Contingency revenue .................... — — 294 — — 294 — 294
Gains on debt repurchases ................ — — — 536 — 536 — 536
Other income ........................ 292 — 55 1 — 348 (285) 63
Total other income ....................... 367 70 1,303 537 (659) 1,618 (285) 1,333
Expenses:
Direct operating expenses .................. 754 265 440 6 (659) 806 — 806
Overhead expenses....................... — — — 237 — 237 — 237
Operating expenses ..................... 754 265 440 243 (659) 1,043 — 1,043
Goodwill and acquired intangible assets impairment
and amortization ...................... — — — — — — 76 76
Restructuring expenses .................... 8 2 2 (2) — 10 — 10
Total expenses ......................... 762 267 442 241 (659) 1,053 76 1,129
Income (loss) from continuing operations, before
income tax expense benefit ................ 526 (50) 881 230 — 1,587 (779) 808
Income tax expense benefit
(3)
................ 186 (18) 311 81 — 560 (296) 264
Net income (loss) from continuing operations ...... 340 (32) 570 149 — 1,027 (483) 544
Loss from discontinued operations, net of taxes ..... — — — (220) — (220) — (220)
Net income (loss) ....................... $ 340 $ (32) $ 570 $ (71) $ — $ 807 $(483) $ 324
(1) The eliminations in servicing revenue and direct operating expense represent the elimination of intercompany servicing revenue where
the Business Services segment performs the loan servicing function for the FFELP Loans segment.
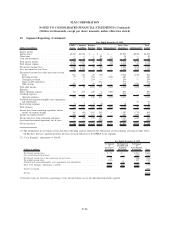
(2) “Core Earnings” adjustments to GAAP:
(Dollars in millions)
Net Impact
of
Derivative
Accounting
Net Impact of
Goodwill and
Acquired
Intangibles
Net Impact
of
Securitization
Accounting Total
Year Ended December 31, 2009
Net interest income (loss) . . . ........................................ $ 78 $— $(941) $(863)
Less: provisions for loan losses ....................................... — — (445) (445)
Net interest income (loss) after provisions for loan losses . . . ..................... 78 — (496) (418)
Total other income (loss) . . . ........................................ (580) — 295 (285)
Goodwill and acquired intangible assets impairment and amortization ................ — 76 — 76
Total “Core Earnings” adjustments to GAAP . .............................. $(502) $(76) $(201) (779)
Income tax benefit . . . ............................................ (296)
Net loss ..................................................... $(483)
(3) Income taxes are based on a percentage of net income before tax for the individual reportable segment.
F-96
SLM CORPORATION
NOTES TO CONSOLIDATED FINANCIAL STATEMENTS (Continued)
(Dollars in thousands, except per share amounts, unless otherwise stated)