Sallie Mae 2010 Annual Report Download - page 46
Download and view the complete annual report
Please find page 46 of the 2010 Sallie Mae annual report below. You can navigate through the pages in the report by either clicking on the pages listed below, or by using the keyword search tool below to find specific information within the annual report.-
 1
1 -
2
-
3
-
4
-
5
-
6
-
7
-
8
-
9
-
10
-
11
-
12
-
13
-
14
-
15
-
16
-
17
-
18
-
19
-
20
-
21
-
22
-
23
-
24
-
25
-
26
-
27
-
28
-
29
-
30
-
31
-
32
-
33
-
34
-
35
-
 36
36 -
 37
37 -
 38
38 -
 39
39 -
 40
40 -
 41
41 -
 42
42 -
 43
43 -
 44
44 -
 45
45 -
 46
46 -
 47
47 -
 48
48 -
 49
49 -
 50
50 -
 51
51 -
 52
52 -
 53
53 -
 54
54 -
 55
55 -
 56
56 -
57
-
58
-
59
-
60
-
61
-
62
-
63
-
64
-
65
-
66
-
67
-
68
-
69
-
70
-
71
-
72
-
73
-
74
-
75
-
76
-
77
-
78
-
79
-
80
-
81
-
82
-
83
-
84
-
85
-
86
-
87
-
88
-
89
-
90
-
91
-
92
-
93
-
94
-
95
-
96
-
97
-
98
-
99
-
100
-
101
-
102
-
103
-
104
-
105
-
106
-
107
-
108
-
109
-
110
-
111
-
112
-
113
-
114
-
115
-
116
-
117
-
118
-
119
-
120
-
121
-
122
-
123
-
124
-
125
-
126
-
127
-
128
-
129
-
130
-
131
-
132
-
133
-
134
-
135
-
136
-
137
-
138
-
139
-
140
-
141
-
142
-
143
-
144
-
145
-
146
-
147
-
148
-
149
-
150
-
151
-
152
-
153
-
154
-
155
-
156
-
157
-
158
-
159
-
160
-
161
-
162
-
163
-
164
-
165
-
166
-
167
-
168
-
169
-
170
-
171
-
172
-
173
-
174
-
175
-
176
-
177
-
178
-
179
-
180
-
181
-
182
-
183
-
184
-
185
-
186
-
187
-
188
-
189
-
190
-
191
-
192
-
193
-
194
-
195
-
196
-
197
-
198
-
199
-
200
-
201
-
202
-
203
-
204
-
205
-
206
-
207
-
208
-
209
-
210
-
211
-
212
-
213
-
214
-
215
-
216
-
217
-
218
-
219
-
220
-
221
-
222
-
223
-
224
-
225
-
226
 |
 |

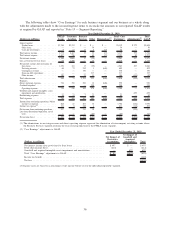
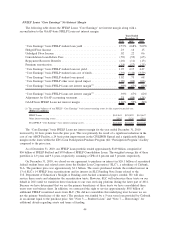
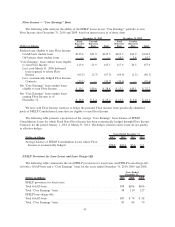
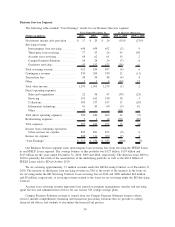
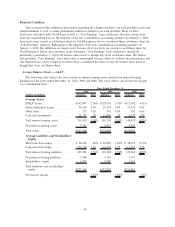
Floor Income — “Core Earnings” Basis
The following table analyzes the ability of the FFELP Loans in our “Core Earnings” portfolio to earn
Floor Income after December 31, 2010 and 2009, based on interest rates as of those dates.
(Dollars in billions)
Fixed
Borrower
Rate
Variable
Borrower
Rate Total
Fixed
Borrower
Rate
Variable
Borrower
Rate Total
December 31, 2010 December 31, 2009
Student loans eligible to earn Floor Income:
GAAP-basis student loans ............ $123.6 $21.9 $145.5 $103.3 $14.9 $118.2
Off-balance sheet student loans ........ — — — 14.3 5.4 19.7
“Core Earnings” basis student loans eligible
to earn Floor Income ................ 123.6 21.9 145.5 117.6 20.3 137.9
Less: post-March 31, 2006 disbursed
loans required to rebate Floor
Income ........................ (65.2) (2.3) (67.5) (64.9) (1.2) (66.1)
Less: economically hedged Floor Income
Contracts....................... (39.2) — (39.2) (39.6) — (39.6)
Net “Core Earnings” basis student loans
eligible to earn Floor Income.......... $ 19.2 $19.6 $ 38.8 $ 13.1 $19.1 $ 32.2
Net “Core Earnings” basis student loans
earning Floor Income as of
December 31, ..................... $ 18.0 $ 1.2 $ 19.2 $ 13.1 $ 3.0 $ 16.1
We have sold Floor Income contracts to hedge the potential Floor Income from specifically identified
pools of FFELP Consolidation Loans that are eligible to earn Floor Income.
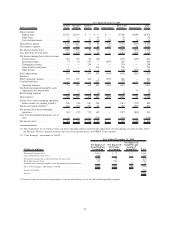
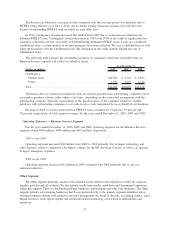
The following table presents a projection of the average “Core Earnings” basis balance of FFELP
Consolidation Loans for which Fixed Rate Floor Income has been economically hedged through Floor Income
Contracts for the period January 1, 2011 to March 31, 2014. The hedges related to these loans do not qualify
as effective hedges.
(Dollars in billions) 2011 2012 2013 2014
Years Ended December 31,
Average balance of FFELP Consolidation Loans whose Floor
Income is economically hedged .......................... $28.8 $20.6 $5.6 $.2
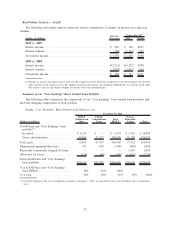
FFELP Provisions for Loan Losses and Loan Charge-Offs
The following tables summarize the total FFELP provisions for loan losses and FFELP Loan charge-offs
on both a GAAP-basis and a “Core Earnings” basis for the years ended December 31, 2010, 2009 and 2008.
(Dollars in millions) 2010 2009 2008
Years Ended
December 31,
FFELP provisions for loan losses:
Total GAAP-basis . . ........................................... $98 $106 $106
Total “Core Earnings” basis ..................................... 98 119 127
FFELP loan charge-offs:
Total GAAP-basis . . ........................................... $87 $ 79 $ 58
Total “Core Earnings” basis ..................................... 87 94 79
45