Sallie Mae 2010 Annual Report Download - page 61
Download and view the complete annual report
Please find page 61 of the 2010 Sallie Mae annual report below. You can navigate through the pages in the report by either clicking on the pages listed below, or by using the keyword search tool below to find specific information within the annual report.-
 1
1 -
2
-
3
-
4
-
5
-
6
-
7
-
8
-
9
-
10
-
11
-
12
-
13
-
14
-
15
-
16
-
17
-
18
-
19
-
20
-
21
-
22
-
23
-
24
-
25
-
26
-
27
-
28
-
29
-
30
-
31
-
32
-
33
-
34
-
35
-
36
-
37
-
38
-
39
-
40
-
41
-
42
-
43
-
44
-
45
-
46
-
47
-
48
-
49
-
50
-
 51
51 -
 52
52 -
 53
53 -
 54
54 -
 55
55 -
 56
56 -
 57
57 -
 58
58 -
 59
59 -
 60
60 -
 61
61 -
 62
62 -
 63
63 -
 64
64 -
 65
65 -
 66
66 -
 67
67 -
 68
68 -
 69
69 -
 70
70 -
 71
71 -
72
-
73
-
74
-
75
-
76
-
77
-
78
-
79
-
80
-
81
-
82
-
83
-
84
-
85
-
86
-
87
-
88
-
89
-
90
-
91
-
92
-
93
-
94
-
95
-
96
-
97
-
98
-
99
-
100
-
101
-
102
-
103
-
104
-
105
-
106
-
107
-
108
-
109
-
110
-
111
-
112
-
113
-
114
-
115
-
116
-
117
-
118
-
119
-
120
-
121
-
122
-
123
-
124
-
125
-
126
-
127
-
128
-
129
-
130
-
131
-
132
-
133
-
134
-
135
-
136
-
137
-
138
-
139
-
140
-
141
-
142
-
143
-
144
-
145
-
146
-
147
-
148
-
149
-
150
-
151
-
152
-
153
-
154
-
155
-
156
-
157
-
158
-
159
-
160
-
161
-
162
-
163
-
164
-
165
-
166
-
167
-
168
-
169
-
170
-
171
-
172
-
173
-
174
-
175
-
176
-
177
-
178
-
179
-
180
-
181
-
182
-
183
-
184
-
185
-
186
-
187
-
188
-
189
-
190
-
191
-
192
-
193
-
194
-
195
-
196
-
197
-
198
-
199
-
200
-
201
-
202
-
203
-
204
-
205
-
206
-
207
-
208
-
209
-
210
-
211
-
212
-
213
-
214
-
215
-
216
-
217
-
218
-
219
-
220
-
221
-
222
-
223
-
224
-
225
-
226
 |
 |

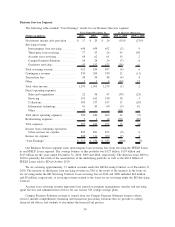
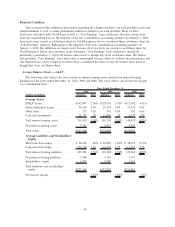
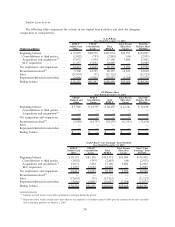
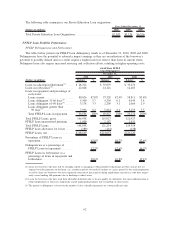
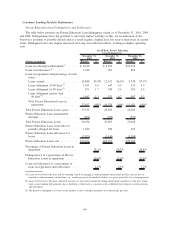
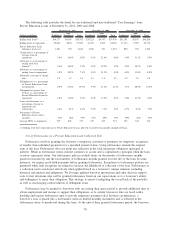
(Dollars in millions)
FFELP
Stafford and
Other
FFELP
Consolidation
Loans
Total
FFELP
Total Private
Education
Loans
Total On-
Balance Sheet
Portfolio
GAAP-Basis
Year Ended December 31, 2008
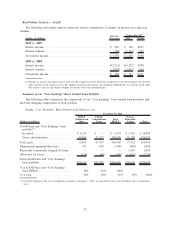
Beginning balance . . ................ $35,726 $73,609 $109,335 $14,818 $124,153
Net consolidations:
Incremental consolidations from third
parties . ...................... — 462 462 149 611
Consolidations to third parties . . ...... (703) (392) (1,095) (41) (1,136)
Net consolidations to third parties . ...... (703) 70 (633) 108 (525)
Acquisitions and originations
(1)
......... 21,889 1,358 23,247 7,357 30,604
Net acquisitions and originations . . ...... 21,186 1,428 22,614 7,465 30,079
Internal consolidations
(2)
.............. (409) 529 120 228 348
Sales . ........................... (522) (26) (548) — (548)
Repayments/defaults/other . ........... (3,505) (3,796) (7,301) (1,929) (9,230)
Ending balance .................... $52,476 $71,744 $124,220 $20,582 $144,802
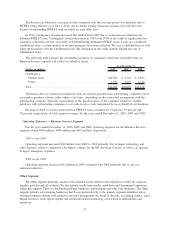
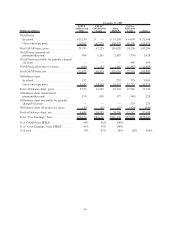
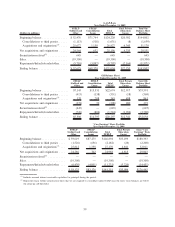
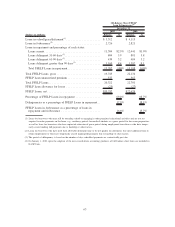
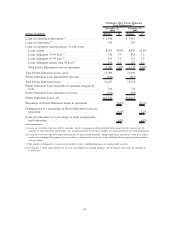
FFELP
Stafford and
Other
FFELP
Consolidation
Loans
Total
FFELP
Total Private
Education
Loans
Total Off-
Balance Sheet
Portfolio
Off-Balance Sheet
Year Ended December 31, 2008
Beginning balance . .................. $9,472 $16,441 $25,913 $13,510 $39,423
Net consolidations:
Incremental consolidations from third
parties . ....................... — — — — —
Consolidations to third parties . . ....... (311) (83) (394) (57) (451)
Net consolidations to third parties . ....... (311) (83) (394) (57) (451)
Acquisitions and originations
(1)
.......... 246 211 457 742 1,199
Net acquisitions and originations. . ....... (65) 128 63 685 748
Internal consolidations
(2)
.............. (84) (36) (120) (228) (348)
Sales. ............................ — — — — —
Repayments/defaults/other . ............ (2,180) (1,002) (3,182) (1,050) (4,232)
Ending balance . . . .................. $7,143 $15,531 $22,674 $12,917 $35,591
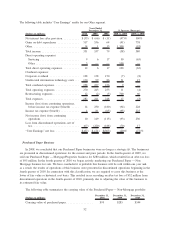
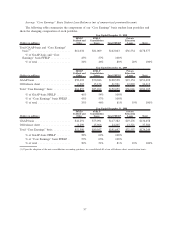
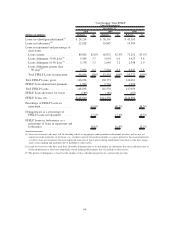
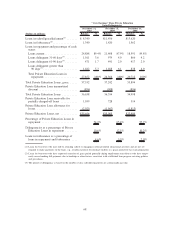
FFELP
Stafford and
Other
FFELP
Consolidation
Loans
Total
FFELP
Total Private
Education
Loans
Total “Core
Earnings” Basis
Portfolio
‘‘Core Earnings” Basis Portfolio
Year Ended December 31, 2008
Beginning balance . ................ $45,198 $90,050 $135,248 $28,328 $163,576
Net consolidations:
Incremental consolidations from third
parties ...................... — 462 462 149 611
Consolidations to third parties . ...... (1,014) (475) (1,489) (98) (1,587)
Net consolidations to third parties ...... (1,014) (13) (1,027) 51 (976)
Acquisitions and originations
(1)
....... 22,135 1,569 23,704 8,099 31,803
Net acquisitions and originations ...... 21,121 1,556 22,677 8,150 30,827
Internal consolidations
(2)
............ (493) 493 — — —
Sales .......................... (522) (26) (548) — (548)
Repayments/defaults/other ........... (5,685) (4,798) (10,483) (2,979) (13,462)
Ending balance . . . ................ $59,619 $87,275 $146,894 $33,499 $180,393
(1)
Includes accrued interest receivable capitalized to principal during the period.
(2)
Represents borrowers consolidating their loans into a new Consolidation Loan. Loans in our off-balance sheet securitization trusts that
are consolidated are bought out of the trusts and included in GAAP-basis.
60