Sallie Mae 2010 Annual Report Download - page 196
Download and view the complete annual report
Please find page 196 of the 2010 Sallie Mae annual report below. You can navigate through the pages in the report by either clicking on the pages listed below, or by using the keyword search tool below to find specific information within the annual report.-
 1
1 -
2
-
3
-
4
-
5
-
6
-
7
-
8
-
9
-
10
-
11
-
12
-
13
-
14
-
15
-
16
-
17
-
18
-
19
-
20
-
21
-
22
-
23
-
24
-
25
-
26
-
27
-
28
-
29
-
30
-
31
-
32
-
33
-
34
-
35
-
36
-
37
-
38
-
39
-
40
-
41
-
42
-
43
-
44
-
45
-
46
-
47
-
48
-
49
-
50
-
51
-
52
-
53
-
54
-
55
-
56
-
57
-
58
-
59
-
60
-
61
-
62
-
63
-
64
-
65
-
66
-
67
-
68
-
69
-
70
-
71
-
72
-
73
-
74
-
75
-
76
-
77
-
78
-
79
-
80
-
81
-
82
-
83
-
84
-
85
-
86
-
87
-
88
-
89
-
90
-
91
-
92
-
93
-
94
-
95
-
96
-
97
-
98
-
99
-
100
-
101
-
102
-
103
-
104
-
105
-
106
-
107
-
108
-
109
-
110
-
111
-
112
-
113
-
114
-
115
-
116
-
117
-
118
-
119
-
120
-
121
-
122
-
123
-
124
-
125
-
126
-
127
-
128
-
129
-
130
-
131
-
132
-
133
-
134
-
135
-
136
-
137
-
138
-
139
-
140
-
141
-
142
-
143
-
144
-
145
-
146
-
147
-
148
-
149
-
150
-
151
-
152
-
153
-
154
-
155
-
156
-
157
-
158
-
159
-
160
-
161
-
162
-
163
-
164
-
165
-
166
-
167
-
168
-
169
-
170
-
171
-
172
-
173
-
174
-
175
-
176
-
177
-
178
-
179
-
180
-
181
-
182
-
183
-
184
-
185
-
 186
186 -
 187
187 -
 188
188 -
 189
189 -
 190
190 -
 191
191 -
 192
192 -
 193
193 -
 194
194 -
 195
195 -
 196
196 -
 197
197 -
 198
198 -
 199
199 -
 200
200 -
 201
201 -
 202
202 -
 203
203 -
 204
204 -
 205
205 -
 206
206 -
207
-
208
-
209
-
210
-
211
-
212
-
213
-
214
-
215
-
216
-
217
-
218
-
219
-
220
-
221
-
222
-
223
-
224
-
225
-
226
 |
 |
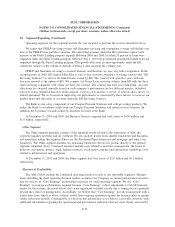
19. Segment Reporting (Continued)
Operating expenses for this segment include the cost incurred to perform the services described above.
We expect that FFELP servicing revenue and Guarantor servicing and contingency revenue will decline over
time as the FFELP Loan portfolios amortize. We expect that revenues under the ED collections contract will
increase as the Direct Lending program expands. Between 2004 and 2008, less than 25 percent of loans were
originated under the Direct Lending program. Effective July 1, 2010, all government guaranteed student loans are
originated through the Direct Lending program. This growth will create revenue opportunity under the ED
collections contract as the volume of defaults of Direct Loans surges in the coming years.
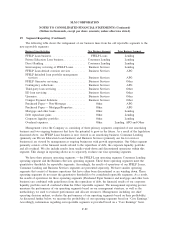
FFELP and Guarantor servicing is a runoff business and therefore we face very little competition. In the
second quarter of 2009, ED named Sallie Mae as one of four servicers awarded a servicing contract (the “ED
Servicing Contract”) to service all federal loans owned by ED. The contract will span five years with one,
five-year renewal at the option of ED. We compete for Direct Loan servicing volume from ED with the three
other servicing companies with whom we share the contract. The contract has four years remaining. Account
allocations are awarded annually based on each company’s performance on five different metrics: defaulted
borrower count, defaulted borrower dollar amount, a survey of borrowers, a survey of schools and a survey of
federal personnel. We are focused on improving our performance as measured by these metrics to increase our
market share and allocation of accounts under the ED Servicing Contract.
The Bank is also a key component of our Campus Payment Solutions and college savings products. We
utilize the Bank to warehouse funds from our Campus Payment Solutions and refund services business. In
addition, the Upromise rewards earned by members are held at the Bank.
At December 31, 2010 and 2009, the Business Services segment had total assets of $930 million and
$1.8 billion, respectively.
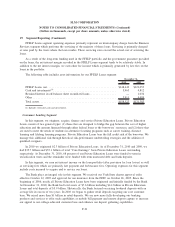
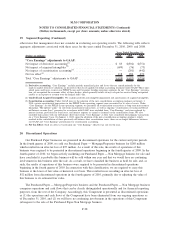
Other Segment
The Other segment primarily consists of the financial results related to the repurchase of debt, the
corporate liquidity portfolio and all overhead. We also include results from smaller wind-down and discontin-
ued operations within this segment. These are the Purchased Paper businesses and mortgage and other loan
businesses. The Other segment includes our remaining businesses that do not pertain directly to the primary
segments identified above. Overhead expenses include costs related to executive management, the board of
directors, accounting, finance, legal, human resources, stock option expense and information technology costs
related to infrastructure and operations.
At December 31, 2010 and 2009, the Other segment had total assets of $2.8 billion and $6.1 billion,
respectively.
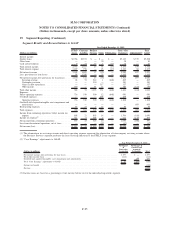
Measure of Profitability
The tables below include the condensed operating results for each of our reportable segments. Manage-
ment, including the chief operating decision makers, evaluates the Company on certain performance measures
that we refer to as “Core Earnings” performance measures for each operating segment. We use “Core
Earnings” to manage each business segment because “Core Earnings” reflect adjustments to GAAP financial
results for three items, discussed below, that create significant volatility mostly due to timing factors generally
beyond the control of management. Accordingly, we believe that “Core Earnings” provide management with a
useful basis from which to better evaluate results from ongoing operations against the business plan or against
results from prior periods. Consequently, we disclose this information as we believe it provides investors with
additional information regarding the operational and performance indicators that are most closely assessed by
F-93
SLM CORPORATION
NOTES TO CONSOLIDATED FINANCIAL STATEMENTS (Continued)
(Dollars in thousands, except per share amounts, unless otherwise stated)