Sallie Mae 2010 Annual Report Download - page 37
Download and view the complete annual report
Please find page 37 of the 2010 Sallie Mae annual report below. You can navigate through the pages in the report by either clicking on the pages listed below, or by using the keyword search tool below to find specific information within the annual report.-
 1
1 -
2
-
3
-
4
-
5
-
6
-
7
-
8
-
9
-
10
-
11
-
12
-
13
-
14
-
15
-
16
-
17
-
18
-
19
-
20
-
21
-
22
-
23
-
24
-
25
-
26
-
 27
27 -
 28
28 -
 29
29 -
 30
30 -
 31
31 -
 32
32 -
 33
33 -
 34
34 -
 35
35 -
 36
36 -
 37
37 -
 38
38 -
 39
39 -
 40
40 -
 41
41 -
 42
42 -
 43
43 -
 44
44 -
 45
45 -
 46
46 -
 47
47 -
48
-
49
-
50
-
51
-
52
-
53
-
54
-
55
-
56
-
57
-
58
-
59
-
60
-
61
-
62
-
63
-
64
-
65
-
66
-
67
-
68
-
69
-
70
-
71
-
72
-
73
-
74
-
75
-
76
-
77
-
78
-
79
-
80
-
81
-
82
-
83
-
84
-
85
-
86
-
87
-
88
-
89
-
90
-
91
-
92
-
93
-
94
-
95
-
96
-
97
-
98
-
99
-
100
-
101
-
102
-
103
-
104
-
105
-
106
-
107
-
108
-
109
-
110
-
111
-
112
-
113
-
114
-
115
-
116
-
117
-
118
-
119
-
120
-
121
-
122
-
123
-
124
-
125
-
126
-
127
-
128
-
129
-
130
-
131
-
132
-
133
-
134
-
135
-
136
-
137
-
138
-
139
-
140
-
141
-
142
-
143
-
144
-
145
-
146
-
147
-
148
-
149
-
150
-
151
-
152
-
153
-
154
-
155
-
156
-
157
-
158
-
159
-
160
-
161
-
162
-
163
-
164
-
165
-
166
-
167
-
168
-
169
-
170
-
171
-
172
-
173
-
174
-
175
-
176
-
177
-
178
-
179
-
180
-
181
-
182
-
183
-
184
-
185
-
186
-
187
-
188
-
189
-
190
-
191
-
192
-
193
-
194
-
195
-
196
-
197
-
198
-
199
-
200
-
201
-
202
-
203
-
204
-
205
-
206
-
207
-
208
-
209
-
210
-
211
-
212
-
213
-
214
-
215
-
216
-
217
-
218
-
219
-
220
-
221
-
222
-
223
-
224
-
225
-
226
 |
 |

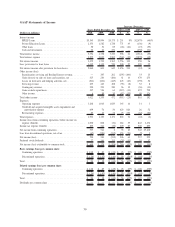
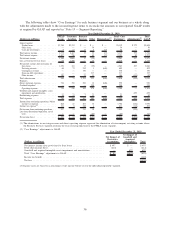
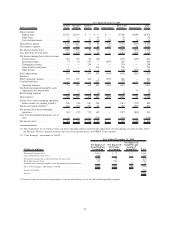
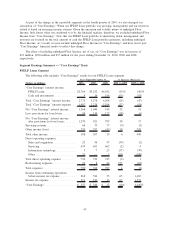
The following tables show “Core Earnings” for each business segment and our business as a whole along
with the adjustments made to the income/expense items to reconcile the amounts to our reported GAAP results
as required by GAAP and reported in “Note 19 — Segment Reporting.”
(Dollars in millions)
FFELP
Loans
Consumer
Lending
Business
Services Other Eliminations
(1)
Total “Core
Earnings” Adjustments
(2)
Total
GAAP
Year Ended December 31, 2010
Interest income:
Student loans . . ............... $2,766 $2,353 $ — $ — $ — $5,119 $ 579 $5,698
Other loans . . . ............... — — — 30 — 30 — 30
Cash and investments . . .......... 9 14 17 3 (17) 26 — 26
Total interest income .............. 2,775 2,367 17 33 (17) 5,175 579 5,754
Total interest expense . . . .......... 1,407 758 — 45 (17) 2,193 82 2,275
Net interest income .............. 1,368 1,609 17 (12) — 2,982 497 3,479
Less: provisions for loan losses . . ..... 98 1,298 — 23 — 1,419 — 1,419
Net interest income after provisions for
loan losses . . . ............... 1,270 311 17 (35) — 1,563 497 2,060
Servicing revenue .............. 68 72 912 1 (648) 405 — 405
Contingency revenue . . .......... — — 330 — — 330 — 330
Gains on debt repurchases ......... — — — 317 — 317 — 317
Other income . . ............... 320 — 51 13 — 384 (414) (30)
Total other income ............... 388 72 1,293 331 (648) 1,436 (414) 1,022
Expenses:
Direct operating expenses . .......... 736 350 500 12 (648) 950 — 950
Overhead expenses ............... — — — 258 — 258 — 258
Operating expenses . . . .......... 736 350 500 270 (648) 1,208 — 1,208
Goodwill and acquired intangible assets
impairment and amortization . . ..... — — — — — — 699 699
Restructuring expenses . . .......... 54 12 7 12 — 85 — 85
Total expenses . . ............... 790 362 507 282 (648) 1,293 699 1,992
Income from continuing operations, before
income tax expense . . . .......... 868 21 803 14 — 1,706 (616) 1,090
Income tax expense
(3)
............. 311 8 288 4 — 611 (118) 493
Net income from continuing operations . . . 557 13 515 10 — 1,095 (498) 597
Loss from discontinued operations, net of
taxes...................... — — — (67) — (67) — (67)
Net income (loss). ............... $ 557 $ 13 $ 515 $(57) $ — $1,028 $(498) $ 530
(1) The eliminations in servicing revenue and direct operating expense represent the elimination of intercompany servicing revenue where
the Business Services segment performs the loan servicing function for the FFELP Loans segment.
(2) “Core Earnings” adjustments to GAAP:
(Dollars in millions)
Net Impact of
Derivative
Accounting
Net Impact of
Goodwill and
Acquired
Intangibles Total
Year Ended December 31, 2010
Net interest income after provisions for loan losses ...................... $497 $ — $497
Total other income (loss) . . ..................................... (414) — (414)
Goodwill and acquired intangible assets impairment and amortization . . . ....... — 699 699
Total “Core Earnings” adjustments to GAAP .......................... $ 83 $(699) (616)
Income tax benefit . .......................................... (118)
Net loss . . . ............................................... $(498)
(3) Income taxes are based on a percentage of net income before tax for the individual reportable segment.
36