Sallie Mae 2010 Annual Report Download - page 52
Download and view the complete annual report
Please find page 52 of the 2010 Sallie Mae annual report below. You can navigate through the pages in the report by either clicking on the pages listed below, or by using the keyword search tool below to find specific information within the annual report.-
 1
1 -
2
-
3
-
4
-
5
-
6
-
7
-
8
-
9
-
10
-
11
-
12
-
13
-
14
-
15
-
16
-
17
-
18
-
19
-
20
-
21
-
22
-
23
-
24
-
25
-
26
-
27
-
28
-
29
-
30
-
31
-
32
-
33
-
34
-
35
-
36
-
37
-
38
-
39
-
40
-
41
-
 42
42 -
 43
43 -
 44
44 -
 45
45 -
 46
46 -
 47
47 -
 48
48 -
 49
49 -
 50
50 -
 51
51 -
 52
52 -
 53
53 -
 54
54 -
 55
55 -
 56
56 -
 57
57 -
 58
58 -
 59
59 -
 60
60 -
 61
61 -
 62
62 -
63
-
64
-
65
-
66
-
67
-
68
-
69
-
70
-
71
-
72
-
73
-
74
-
75
-
76
-
77
-
78
-
79
-
80
-
81
-
82
-
83
-
84
-
85
-
86
-
87
-
88
-
89
-
90
-
91
-
92
-
93
-
94
-
95
-
96
-
97
-
98
-
99
-
100
-
101
-
102
-
103
-
104
-
105
-
106
-
107
-
108
-
109
-
110
-
111
-
112
-
113
-
114
-
115
-
116
-
117
-
118
-
119
-
120
-
121
-
122
-
123
-
124
-
125
-
126
-
127
-
128
-
129
-
130
-
131
-
132
-
133
-
134
-
135
-
136
-
137
-
138
-
139
-
140
-
141
-
142
-
143
-
144
-
145
-
146
-
147
-
148
-
149
-
150
-
151
-
152
-
153
-
154
-
155
-
156
-
157
-
158
-
159
-
160
-
161
-
162
-
163
-
164
-
165
-
166
-
167
-
168
-
169
-
170
-
171
-
172
-
173
-
174
-
175
-
176
-
177
-
178
-
179
-
180
-
181
-
182
-
183
-
184
-
185
-
186
-
187
-
188
-
189
-
190
-
191
-
192
-
193
-
194
-
195
-
196
-
197
-
198
-
199
-
200
-
201
-
202
-
203
-
204
-
205
-
206
-
207
-
208
-
209
-
210
-
211
-
212
-
213
-
214
-
215
-
216
-
217
-
218
-
219
-
220
-
221
-
222
-
223
-
224
-
225
-
226
 |
 |

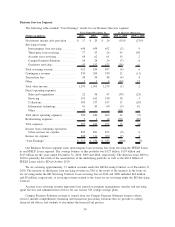
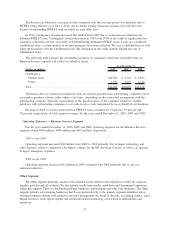
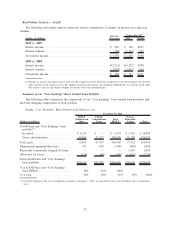
The decrease in Guarantor servicing revenue compared with the year-ago period was primarily due to
HCERA being effective as of July 1, 2010, our no longer earning Guarantor issuance fees and the lower
balance of outstanding FFELP Loans on which we earn other fees.
In 2010, contingency revenue increased $36 million from 2009 due to an increase in collections on
defaulted FFELP Loans. Contingency revenue decreased in 2009 from 2008 as the result of significantly less
Guarantor collections revenue associated with rehabilitating delinquent FFELP Loans. Loans are considered
rehabilitated after a certain number of on-time payments have been collected. We earn a rehabilitation fee only
when the Guarantor sells the rehabilitated loan. The disruption in the credit markets limited the sale of
rehabilitated loans.
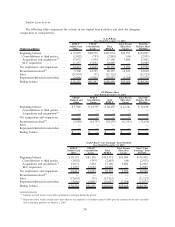
The following table presents the outstanding inventory of contingent collections receivables that our
Business Services segment will collect on behalf of others.
(Dollars in millions) 2010 2009 2008
As of December 31,
Contingency:
Student loans ....................................... $10,362 $ 8,762 $ 9,852
Other............................................. 1,730 1,262 1,726
Total ............................................... $12,092 $10,024 $11,578
Transaction fees are earned in conjunction with our rewards program from participating companies based
on member purchase activity, either online or in stores, depending on the contractual arrangement with the
participating company. Typically, a percentage of the purchase price of the consumer members’ eligible
purchases with participating companies is set aside in an account maintained by us on behalf of our members.
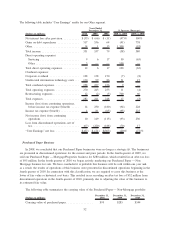
Revenues related to services performed on FFELP Loans accounted for 78 percent, 79 percent and
79 percent, respectively, of total segment revenues for the years ended December 31, 2010, 2009 and 2008.
Operating Expenses — Business Services Segment
For the years ended December 31, 2010, 2009 and 2008, operating expenses for the Business Services
segment totaled $500 million, $440 million and $462 million, respectively.
2010 versus 2009
Operating expenses increased $60 million from 2009 to 2010 primarily due to higher technology and
other expenses related to preparation for higher volumes for the ED Servicing Contract as well as an increase
in legal contingency expenses.
2009 versus 2008
Operating expenses decreased $22 million in 2009 compared with 2008 primarily due to our cost
reduction initiatives.
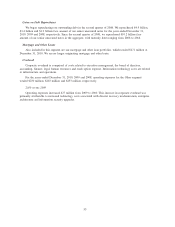
Other Segment
The Other segment primarily consists of the financial results related to the repurchase of debt, the corporate
liquidity portfolio and all overhead. We also include results from smaller wind-down and discontinued operations
within this segment. These are the Purchased Paper businesses and mortgage and other loan businesses. The Other
segment includes our remaining businesses that do not pertain directly to the primary segments identified above.
Overhead expenses include costs related to executive management, the board of directors, accounting, finance, legal,
human resources, stock option expense and certain information technology costs related to infrastructure and
operations.
51