Sallie Mae 2010 Annual Report Download - page 185
Download and view the complete annual report
Please find page 185 of the 2010 Sallie Mae annual report below. You can navigate through the pages in the report by either clicking on the pages listed below, or by using the keyword search tool below to find specific information within the annual report.-
 1
1 -
2
-
3
-
4
-
5
-
6
-
7
-
8
-
9
-
10
-
11
-
12
-
13
-
14
-
15
-
16
-
17
-
18
-
19
-
20
-
21
-
22
-
23
-
24
-
25
-
26
-
27
-
28
-
29
-
30
-
31
-
32
-
33
-
34
-
35
-
36
-
37
-
38
-
39
-
40
-
41
-
42
-
43
-
44
-
45
-
46
-
47
-
48
-
49
-
50
-
51
-
52
-
53
-
54
-
55
-
56
-
57
-
58
-
59
-
60
-
61
-
62
-
63
-
64
-
65
-
66
-
67
-
68
-
69
-
70
-
71
-
72
-
73
-
74
-
75
-
76
-
77
-
78
-
79
-
80
-
81
-
82
-
83
-
84
-
85
-
86
-
87
-
88
-
89
-
90
-
91
-
92
-
93
-
94
-
95
-
96
-
97
-
98
-
99
-
100
-
101
-
102
-
103
-
104
-
105
-
106
-
107
-
108
-
109
-
110
-
111
-
112
-
113
-
114
-
115
-
116
-
117
-
118
-
119
-
120
-
121
-
122
-
123
-
124
-
125
-
126
-
127
-
128
-
129
-
130
-
131
-
132
-
133
-
134
-
135
-
136
-
137
-
138
-
139
-
140
-
141
-
142
-
143
-
144
-
145
-
146
-
147
-
148
-
149
-
150
-
151
-
152
-
153
-
154
-
155
-
156
-
157
-
158
-
159
-
160
-
161
-
162
-
163
-
164
-
165
-
166
-
167
-
168
-
169
-
170
-
171
-
172
-
173
-
174
-
 175
175 -
 176
176 -
 177
177 -
 178
178 -
 179
179 -
 180
180 -
 181
181 -
 182
182 -
 183
183 -
 184
184 -
 185
185 -
 186
186 -
 187
187 -
 188
188 -
 189
189 -
 190
190 -
 191
191 -
 192
192 -
 193
193 -
 194
194 -
 195
195 -
196
-
197
-
198
-
199
-
200
-
201
-
202
-
203
-
204
-
205
-
206
-
207
-
208
-
209
-
210
-
211
-
212
-
213
-
214
-
215
-
216
-
217
-
218
-
219
-
220
-
221
-
222
-
223
-
224
-
225
-
226
 |
 |

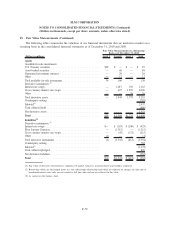
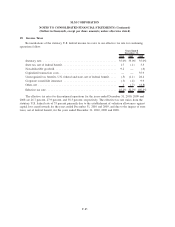
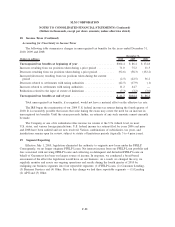
15. Fair Value Measurements (Continued)
The following table summarizes the fair values of our financial assets and liabilities, including derivative
financial instruments, as of December 31, 2010 and 2009.
(Dollars in millions)
Fair
Value
Carrying
Value Difference
Fair
Value
Carrying
Value Difference
December 31, 2010 December 31, 2009
Earning assets
FFELP Loans ................. $147,163 $148,649 $(1,486) $119,747 $121,053 $(1,306)
Private Education Loans ......... 30,949 35,656 (4,707) 20,278 22,753 (2,475)
Other loans .................. 88 270 (182) 219 420 (201)
Cash and investments . .......... 11,553 11,553 — 13,253 13,253 —
Total earning assets . . .......... 189,753 196,128 (6,375) 153,497 157,479 (3,982)
Interest-bearing liabilities
Short-term borrowings .......... 33,604 33,616 12 30,988 30,897 (91)
Long-term borrowings .......... 154,355 163,544 9,189 123,049 130,546 7,497
Total interest-bearing liabilities .... 187,959 197,160 9,201 154,037 161,443 7,406
Derivative financial instruments
Floor Income/Cap contracts ...... (1,315) (1,315) — (1,234) (1,234) —
Interest rate swaps . . . .......... 744 744 — 94 94 —
Cross currency interest rate swaps . . 1,811 1,811 — 2,783 2,783 —
Other ....................... 25 25 — (20) (20) —
Other
Residual interest in securitized
assets ..................... — 1,828 1,828 —
Excess of net asset fair value over
carrying value .............. $2,826 $ 3,424
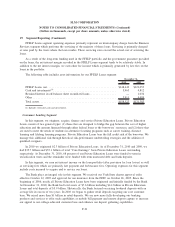
16. Commitments, Contingencies and Guarantees
We offer a line of credit to certain financial institutions and other institutions in the higher education
community for the purpose of originating student loans. In connection with these agreements, we also enter
into a participation agreement with the institution to participate in the loans as they are originated. In the
event that a line of credit is drawn upon, the loan is collateralized by underlying student loans and is usually
participated in on the same day. The contractual amount of these financial instruments represents the
maximum possible credit risk should the counterparty draw down the commitment, we do not participate in
the loan and the counterparty subsequently fails to perform according to the terms of its contract with us. At
December 31, 2010 and 2009, the contractual amount of these financial obligations was $50 million and
$850 million, respectively. There were no outstanding draws at December 31, 2010.
In addition, we maintain forward contracts to purchase loans from our lending partners at contractual
prices. These contracts typically have a maximum amount we are committed to buy, but lack a fixed or
determinable amount as it ultimately is based on the lending partner’s origination activity. FFELP forward
purchase contracts typically contain language relieving us of most of our responsibilities under the contract
due to, among other things, changes in student loan legislation. These commitments are not accounted for as
F-82
SLM CORPORATION
NOTES TO CONSOLIDATED FINANCIAL STATEMENTS (Continued)
(Dollars in thousands, except per share amounts, unless otherwise stated)