Sallie Mae 2010 Annual Report Download - page 25
Download and view the complete annual report
Please find page 25 of the 2010 Sallie Mae annual report below. You can navigate through the pages in the report by either clicking on the pages listed below, or by using the keyword search tool below to find specific information within the annual report.-
 1
1 -
2
-
3
-
4
-
5
-
6
-
7
-
8
-
9
-
10
-
11
-
12
-
13
-
14
-
 15
15 -
 16
16 -
 17
17 -
 18
18 -
 19
19 -
 20
20 -
 21
21 -
 22
22 -
 23
23 -
 24
24 -
 25
25 -
 26
26 -
 27
27 -
 28
28 -
 29
29 -
 30
30 -
 31
31 -
 32
32 -
 33
33 -
 34
34 -
 35
35 -
36
-
37
-
38
-
39
-
40
-
41
-
42
-
43
-
44
-
45
-
46
-
47
-
48
-
49
-
50
-
51
-
52
-
53
-
54
-
55
-
56
-
57
-
58
-
59
-
60
-
61
-
62
-
63
-
64
-
65
-
66
-
67
-
68
-
69
-
70
-
71
-
72
-
73
-
74
-
75
-
76
-
77
-
78
-
79
-
80
-
81
-
82
-
83
-
84
-
85
-
86
-
87
-
88
-
89
-
90
-
91
-
92
-
93
-
94
-
95
-
96
-
97
-
98
-
99
-
100
-
101
-
102
-
103
-
104
-
105
-
106
-
107
-
108
-
109
-
110
-
111
-
112
-
113
-
114
-
115
-
116
-
117
-
118
-
119
-
120
-
121
-
122
-
123
-
124
-
125
-
126
-
127
-
128
-
129
-
130
-
131
-
132
-
133
-
134
-
135
-
136
-
137
-
138
-
139
-
140
-
141
-
142
-
143
-
144
-
145
-
146
-
147
-
148
-
149
-
150
-
151
-
152
-
153
-
154
-
155
-
156
-
157
-
158
-
159
-
160
-
161
-
162
-
163
-
164
-
165
-
166
-
167
-
168
-
169
-
170
-
171
-
172
-
173
-
174
-
175
-
176
-
177
-
178
-
179
-
180
-
181
-
182
-
183
-
184
-
185
-
186
-
187
-
188
-
189
-
190
-
191
-
192
-
193
-
194
-
195
-
196
-
197
-
198
-
199
-
200
-
201
-
202
-
203
-
204
-
205
-
206
-
207
-
208
-
209
-
210
-
211
-
212
-
213
-
214
-
215
-
216
-
217
-
218
-
219
-
220
-
221
-
222
-
223
-
224
-
225
-
226
 |
 |

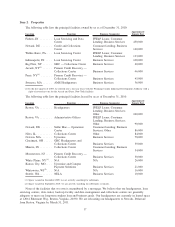
The following table shows how we realigned our old reportable segments existing prior to the fourth
quarter of 2010 into our new business lines as part of the change in business segments discussed above.
Business Lines/Activities New Business Segment Prior Business Segment
FFELP Loan business ............................. FFELP Loans Lending
Private Education Loan business ..................... Consumer Lending Lending
Direct Banking .................................. Consumer Lending Lending
Intercompany servicing of FFELP Loans . . . ............ Business Services Lending
FFELP Loan default aversion services ................. Business Services APG
FFELP defaulted loan portfolio management services ...... Business Services APG
FFELP Guarantor servicing ......................... Business Services Other
Contingency collections............................ Business Services APG
Third-party loan servicing .......................... Business Services Other
ED loan servicing ................................ Business Services Other
Upromise ...................................... Business Services Other
Campus Payment Solutions ......................... Business Services Other
Purchased Paper — Non-Mortgage.................... Other APG
Purchased Paper — Mortgage/Properties . . . ............ Other APG
Mortgage and other loans .......................... Other Lending
Debt repurchase gains ............................. Other Lending
Corporate liquidity portfolio ........................ Other Lending
Overhead expenses ............................... Other Lending, APG and Other
Key Financial Measures
Our operating results are primarily driven by net interest income from our student loan portfolios, provision
for loan losses, financing costs, costs necessary to generate new assets, the revenues and expenses generated by our
service businesses and gains and losses on loan sales, debt repurchases and derivatives. We manage and assess the
performance of each business segment separately as each is focused on different customer bases and derive their
revenue from different activities and services. A brief summary of our key financial measures are listed below.
Net Interest Income
The most significant portion of our earnings are generated by the spread earned between the interest
revenue we receive on assets in our student loan portfolios and the interest cost of funding these loans. We
report these earnings as net interest income. Net interest income in our FFELP Loans and Consumer Lending
segments are driven by significantly different factors.
FFELP Loans Segment
Net interest income will be the primary source of cash flow generated by this segment as the portfolio
runs off and we will no longer generate revenues from new originations. We may continue to acquire existing
portfolios of FFELP Loans from third parties. We would expect any acquisitions to be accretive. The FFELP
Loans segment’s net interest margin was 93 basis points in 2010 compared with 67 basis points in 2009. The
major sources of variability in net interest margin are expected to be the CP/LIBOR spread and Floor Income.
• We refer to the spread between the Federal Reserve’s 3-month financial commercial paper index (“CP”) and
3-month LIBOR as the “CP/LIBOR spread”. Interest earned on our FFELP Loan assets are indexed
primarily to CP and interest paid on their related funding liabilities are primarily indexed to 3-month
LIBOR. Movements in the CP and 3-month LIBOR rates expand or contract the CP/LIBOR spread and our
net interest income decreases or increases as a result. During the capital markets turmoil of recent years, the
CP/LIBOR spread has suffered dramatic fluctuations that have negatively affected net interest income
significantly. For 2010, the average CP/LIBOR spread returned to historical levels.
• Pursuant to the terms of the FFELP, certain FFELP Loans, in certain situations, continue to earn interest at
the stated fixed rate of interest even if underlying debt costs decrease. We refer to this additional spread
24