Sallie Mae 2010 Annual Report Download - page 112
Download and view the complete annual report
Please find page 112 of the 2010 Sallie Mae annual report below. You can navigate through the pages in the report by either clicking on the pages listed below, or by using the keyword search tool below to find specific information within the annual report.-
 1
1 -
2
-
3
-
4
-
5
-
6
-
7
-
8
-
9
-
10
-
11
-
12
-
13
-
14
-
15
-
16
-
17
-
18
-
19
-
20
-
21
-
22
-
23
-
24
-
25
-
26
-
27
-
28
-
29
-
30
-
31
-
32
-
33
-
34
-
35
-
36
-
37
-
38
-
39
-
40
-
41
-
42
-
43
-
44
-
45
-
46
-
47
-
48
-
49
-
50
-
51
-
52
-
53
-
54
-
55
-
56
-
57
-
58
-
59
-
60
-
61
-
62
-
63
-
64
-
65
-
66
-
67
-
68
-
69
-
70
-
71
-
72
-
73
-
74
-
75
-
76
-
77
-
78
-
79
-
80
-
81
-
82
-
83
-
84
-
85
-
86
-
87
-
88
-
89
-
90
-
91
-
92
-
93
-
94
-
95
-
96
-
97
-
98
-
99
-
100
-
101
-
 102
102 -
 103
103 -
 104
104 -
 105
105 -
 106
106 -
 107
107 -
 108
108 -
 109
109 -
 110
110 -
 111
111 -
 112
112 -
 113
113 -
 114
114 -
 115
115 -
 116
116 -
 117
117 -
 118
118 -
 119
119 -
 120
120 -
 121
121 -
 122
122 -
123
-
124
-
125
-
126
-
127
-
128
-
129
-
130
-
131
-
132
-
133
-
134
-
135
-
136
-
137
-
138
-
139
-
140
-
141
-
142
-
143
-
144
-
145
-
146
-
147
-
148
-
149
-
150
-
151
-
152
-
153
-
154
-
155
-
156
-
157
-
158
-
159
-
160
-
161
-
162
-
163
-
164
-
165
-
166
-
167
-
168
-
169
-
170
-
171
-
172
-
173
-
174
-
175
-
176
-
177
-
178
-
179
-
180
-
181
-
182
-
183
-
184
-
185
-
186
-
187
-
188
-
189
-
190
-
191
-
192
-
193
-
194
-
195
-
196
-
197
-
198
-
199
-
200
-
201
-
202
-
203
-
204
-
205
-
206
-
207
-
208
-
209
-
210
-
211
-
212
-
213
-
214
-
215
-
216
-
217
-
218
-
219
-
220
-
221
-
222
-
223
-
224
-
225
-
226
 |
 |

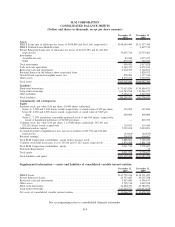
SLM CORPORATION
CONSOLIDATED STATEMENTS OF CASH FLOWS
(Dollars in thousands)
2010 2009 2008
Years Ended December 31,
Operating activities
Net income (loss) .................................................. $ 530,382 $ 324,138 $ (212,626)
Adjustments to reconcile net income (loss) to net cash used in operating activities:
Loss from discontinued operations, net of tax ............................. 67,148 219,872 215,106
(Gains) losses on loans and securities, net ................................ (5,987) 580 186,155
Goodwill and acquired intangible assets impairment and amortization expense ......... 698,902 75,960 49,674
Stock-based compensation cost ...................................... 39,750 51,065 86,271
Unrealized (gains)/losses on derivative and hedging activities ................... (478,446) 324,443 559,895
Provisions for loan losses .......................................... 1,419,413 1,118,960 719,650
Student loans originated for sale, net ................................... (9,647,617) (19,099,583) (7,787,869)
(Increase) decrease in restricted cash — other ............................. (2,327) 40,051 96,617
(Increase) decrease in accrued interest receivable ........................... (3,928) 893,516 (279,082)
(Decrease) in accrued interest payable .................................. (77,180) (517,401) (200,501)
Adjustment for non-cash (income)/loss related to Retained Interest ................ — 329,953 425,462
Decrease (increase) in other assets .................................... 888,951 (160,700) 304,038
(Decrease) in other liabilities ........................................ (121,555) (29,276) (155,768)
Cash (used in) operating activities — continuing operations ...................... (6,692,494) (16,428,422) (5,992,978)
Cash provided by operating activities — discontinued operations ................... — 514,713 301,234
Total net cash (used in) operating activities .................................. (6,692,494) (15,913,709) (5,691,744)
Investing activities
Student loans acquired ............................................. (8,818,775) (9,403,093) (23,337,946)
Loans purchased from securitized trusts .................................. — (5,978) (1,243,671)
Reduction of student loans:
Installment payments, claims and other ................................. 14,019,904 10,749,227 10,333,901
Proceeds from sales of student loans ................................... 587,540 788,221 496,183
Other loans — originated ............................................ (15) (2,823) (1,138,355)
Other loans — repaid .............................................. 131,991 261,491 1,542,307
Other investing activities, net ......................................... (227,644) (703,758) (60,483)
Purchases of available-for-sale securities .................................. (38,303,181) (128,478,198) (101,140,587)
Proceeds from sales of available-for-sale securities ............................ — 100,056 328,530
Proceeds from maturities of available-for-sale securities ........................ 39,465,282 127,951,879 102,436,912
Purchases of held-to-maturity and other securities ............................ (141,783) (889) (500,255)
Proceeds from maturities of held-to-maturity securities and other securities ............ 135,936 79,171 407,180
Decrease (increase) in restricted cash — on-balance sheet trusts.................... 426,224 (1,181,275) 918,403
Return of investment from Retained Interest ................................ — 26,513 403,020
Purchase of subsidiaries, net of cash acquired ............................... — — (37,868)
Cash provided by (used in) investing activities — continuing operations .............. 7,275,479 180,544 (10,592,729)
Cash provided by (used in) investing activities — discontinued operations ............. 138,631 130,507 (74,558)
Total net cash provided by (used in) investing activities......................... 7,414,110 311,051 (10,667,287)
Financing activities
Borrowings collateralized by loans in trust — issued ........................... 5,917,192 12,997,915 17,986,955
Borrowings collateralized by loans in trust — repaid ........................... (10,635,667) (5,689,713) (6,299,483)
Asset-backed commercial paper conduits, net ............................... (2,060,387) (16,138,186) (1,649,287)
ED Participation Program, net......................................... 11,251,560 19,301,929 7,364,969
ED Conduit Program facility, net ....................................... 663,707 14,313,837 —
Other short-term borrowings issued ..................................... — 298,294 2,592,429
Other short-term borrowings repaid ..................................... (167,849) (1,434,538) (1,512,031)
Other long-term borrowings issued ...................................... 1,463,549 4,333,181 3,563,003
Other long-term borrowings repaid ...................................... (9,954,538) (9,504,267) (9,518,655)
Other financing activities, net ......................................... 1,145,046 (751,087) 284,659
Excess tax benefit from the exercise of stock-based awards ...................... 373 — 281
Common stock issued .............................................. 195 664 5,979
Preferred stock issued .............................................. — — 145,345
Preferred dividends paid ............................................ (71,849) (115,775) (110,556)
Noncontrolling interest, net .......................................... (634) (9,585) (6,606)
Net cash (used in) provided by financing activities ............................ (2,449,302) 17,602,669 12,847,002
Net (decrease) increase in cash and cash equivalents ............................ (1,727,686) 2,000,011 (3,512,029)
Cash and cash equivalents at beginning of year ............................... 6,070,013 4,070,002 7,582,031
Cash and cash equivalents at end of year.................................. $ 4,342,327 $ 6,070,013 $ 4,070,002
Cash disbursements made (refunds received) for:
Interest ....................................................... $ 2,372,182 $ 3,656,545 $ 6,157,096
Income taxes, net ................................................ $ (428,200) $ 298,285 $ 699,364
Noncash activity:
Investing activity — Student loans acquired from the Student Loan Corporation ......... $25,638,570 $ — $ —
Financing activity — Borrowings assumed in acquisition from the Student Loan
Corporation................................................... $26,014,125 $ — $ —
See accompanying notes to consolidated financial statements.
F-9