Sallie Mae 2010 Annual Report Download - page 169
Download and view the complete annual report
Please find page 169 of the 2010 Sallie Mae annual report below. You can navigate through the pages in the report by either clicking on the pages listed below, or by using the keyword search tool below to find specific information within the annual report.-
 1
1 -
2
-
3
-
4
-
5
-
6
-
7
-
8
-
9
-
10
-
11
-
12
-
13
-
14
-
15
-
16
-
17
-
18
-
19
-
20
-
21
-
22
-
23
-
24
-
25
-
26
-
27
-
28
-
29
-
30
-
31
-
32
-
33
-
34
-
35
-
36
-
37
-
38
-
39
-
40
-
41
-
42
-
43
-
44
-
45
-
46
-
47
-
48
-
49
-
50
-
51
-
52
-
53
-
54
-
55
-
56
-
57
-
58
-
59
-
60
-
61
-
62
-
63
-
64
-
65
-
66
-
67
-
68
-
69
-
70
-
71
-
72
-
73
-
74
-
75
-
76
-
77
-
78
-
79
-
80
-
81
-
82
-
83
-
84
-
85
-
86
-
87
-
88
-
89
-
90
-
91
-
92
-
93
-
94
-
95
-
96
-
97
-
98
-
99
-
100
-
101
-
102
-
103
-
104
-
105
-
106
-
107
-
108
-
109
-
110
-
111
-
112
-
113
-
114
-
115
-
116
-
117
-
118
-
119
-
120
-
121
-
122
-
123
-
124
-
125
-
126
-
127
-
128
-
129
-
130
-
131
-
132
-
133
-
134
-
135
-
136
-
137
-
138
-
139
-
140
-
141
-
142
-
143
-
144
-
145
-
146
-
147
-
148
-
149
-
150
-
151
-
152
-
153
-
154
-
155
-
156
-
157
-
158
-
 159
159 -
 160
160 -
 161
161 -
 162
162 -
 163
163 -
 164
164 -
 165
165 -
 166
166 -
 167
167 -
 168
168 -
 169
169 -
 170
170 -
 171
171 -
 172
172 -
 173
173 -
 174
174 -
 175
175 -
 176
176 -
 177
177 -
 178
178 -
 179
179 -
180
-
181
-
182
-
183
-
184
-
185
-
186
-
187
-
188
-
189
-
190
-
191
-
192
-
193
-
194
-
195
-
196
-
197
-
198
-
199
-
200
-
201
-
202
-
203
-
204
-
205
-
206
-
207
-
208
-
209
-
210
-
211
-
212
-
213
-
214
-
215
-
216
-
217
-
218
-
219
-
220
-
221
-
222
-
223
-
224
-
225
-
226
 |
 |

9. Derivative Financial Instruments (Continued)
Our corporate derivatives contain credit contingent features. At our current unsecured credit rating, we
have fully collateralized our corporate derivative liability position (including accrued interest and net of
premiums receivable) of $711 million with our counterparties. Further downgrades would not result in any
additional collateral requirements, except to increase the frequency of collateral calls. Two counterparties have
the right to terminate the contracts with further downgrades. We currently have a liability position with these
derivative counterparties (including accrued interest and net of premiums receivable) of $92 million and have
posted $95 million of collateral to these counterparties. If the credit contingent feature was triggered for these
two counterparties and the counterparties exercised their right to terminate, we would not be required to
deliver additional assets to settle the contracts. Trust related derivatives do not contain credit contingent
features related to our or the trusts’ credit ratings.
At December 31, 2009, $381 million in collateral related to off-balance sheet trust derivatives were held
by previously off-balance sheet trusts. Collateral posted by third parties to the off-balance sheet trusts cannot
be sold or re-pledged by the trusts. As of January 1, 2010, the off-balance sheet trusts were consolidated with
the adoption of topic updates to ASC 810. (See Note 2, “Significant Accounting Policies — Consolidations.”)
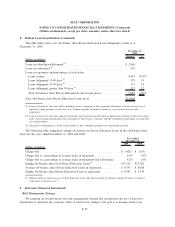
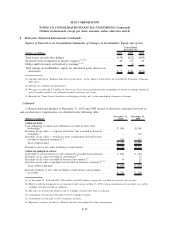
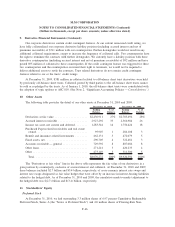
10. Other Assets
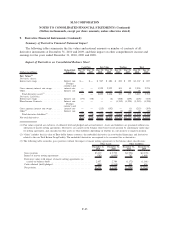
The following table provides the detail of our other assets at December 31, 2010 and 2009.
Ending
Balance
%of
Balance
Ending
Balance
%of
Balance
December 31, 2010 December 31, 2009
Derivatives at fair value ..................... $2,436,911 27% $2,783,696 28%
Accrued interest receivable ................... 2,927,292 33 2,566,984 26
Income tax asset, net current and deferred ........ 1,283,344 14 1,750,424 18
Purchased Paper-related receivables and real estate
owned................................. 95,907 1 286,108 3
Benefit and insurance-related investments ........ 462,131 5 472,079 5
Fixed assets, net ........................... 290,705 4 322,481 3
Accounts receivable — general ................ 729,592 8 807,086 8
Other loans............................... 271,241 3 420,233 4
Other ................................... 473,149 5 511,500 5
Total .................................. $8,970,272 100% $9,920,591 100%
The “Derivatives at fair value” line in the above table represents the fair value of our derivatives in a
gain position by counterparty, exclusive of accrued interest and collateral. At December 31, 2010 and 2009,
these balances included $2.7 billion and $3.4 billion, respectively, of cross-currency interest rate swaps and
interest rate swaps designated as fair value hedges that were offset by an increase in interest-bearing liabilities
related to the hedged debt. As of December 31, 2010 and 2009, the cumulative mark-to-market adjustment to
the hedged debt was $(2.7) billion and $(3.4) billion, respectively.
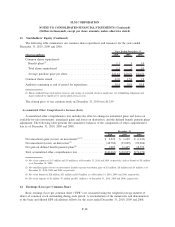
11. Stockholders’ Equity
Preferred Stock
At December 31, 2010, we had outstanding 3.3 million shares of 6.97 percent Cumulative Redeemable
Preferred Stock, Series A (the “Series A Preferred Stock”) and 4.0 million shares of Floating-Rate Non-
F-66
SLM CORPORATION
NOTES TO CONSOLIDATED FINANCIAL STATEMENTS (Continued)
(Dollars in thousands, except per share amounts, unless otherwise stated)