Sallie Mae 2010 Annual Report Download - page 162
Download and view the complete annual report
Please find page 162 of the 2010 Sallie Mae annual report below. You can navigate through the pages in the report by either clicking on the pages listed below, or by using the keyword search tool below to find specific information within the annual report.-
 1
1 -
2
-
3
-
4
-
5
-
6
-
7
-
8
-
9
-
10
-
11
-
12
-
13
-
14
-
15
-
16
-
17
-
18
-
19
-
20
-
21
-
22
-
23
-
24
-
25
-
26
-
27
-
28
-
29
-
30
-
31
-
32
-
33
-
34
-
35
-
36
-
37
-
38
-
39
-
40
-
41
-
42
-
43
-
44
-
45
-
46
-
47
-
48
-
49
-
50
-
51
-
52
-
53
-
54
-
55
-
56
-
57
-
58
-
59
-
60
-
61
-
62
-
63
-
64
-
65
-
66
-
67
-
68
-
69
-
70
-
71
-
72
-
73
-
74
-
75
-
76
-
77
-
78
-
79
-
80
-
81
-
82
-
83
-
84
-
85
-
86
-
87
-
88
-
89
-
90
-
91
-
92
-
93
-
94
-
95
-
96
-
97
-
98
-
99
-
100
-
101
-
102
-
103
-
104
-
105
-
106
-
107
-
108
-
109
-
110
-
111
-
112
-
113
-
114
-
115
-
116
-
117
-
118
-
119
-
120
-
121
-
122
-
123
-
124
-
125
-
126
-
127
-
128
-
129
-
130
-
131
-
132
-
133
-
134
-
135
-
136
-
137
-
138
-
139
-
140
-
141
-
142
-
143
-
144
-
145
-
146
-
147
-
148
-
149
-
150
-
151
-
 152
152 -
 153
153 -
 154
154 -
 155
155 -
 156
156 -
 157
157 -
 158
158 -
 159
159 -
 160
160 -
 161
161 -
 162
162 -
 163
163 -
 164
164 -
 165
165 -
 166
166 -
 167
167 -
 168
168 -
 169
169 -
 170
170 -
 171
171 -
 172
172 -
173
-
174
-
175
-
176
-
177
-
178
-
179
-
180
-
181
-
182
-
183
-
184
-
185
-
186
-
187
-
188
-
189
-
190
-
191
-
192
-
193
-
194
-
195
-
196
-
197
-
198
-
199
-
200
-
201
-
202
-
203
-
204
-
205
-
206
-
207
-
208
-
209
-
210
-
211
-
212
-
213
-
214
-
215
-
216
-
217
-
218
-
219
-
220
-
221
-
222
-
223
-
224
-
225
-
226
 |
 |

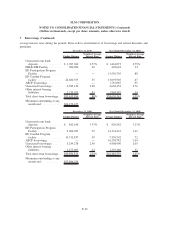
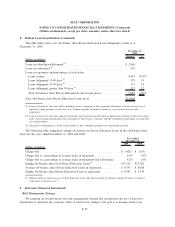
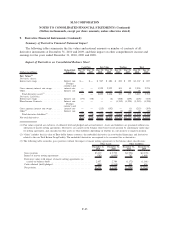
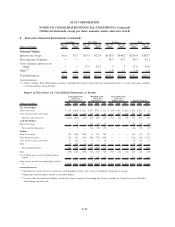
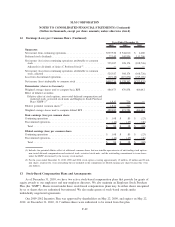
8. Student Loan Securitization (Continued)
The table below shows our off-balance sheet Private Education Loan delinquency trends as of
December 31, 2009.
Balance %
December 31,
2009
(Dollars in millions)
Loans in-school/grace/deferment
(1)
.................................... $ 2,546
Loans in forbearance
(2)
............................................. 453
Loans in repayment and percentage of each status:
Loans current .................................................. 8,987 90.0%
Loans delinquent 31-60 days
(3)
..................................... 332 3.3
Loans delinquent 61-90 days
(3)
..................................... 151 1.5
Loans delinquent greater than 90 days
(3)
.............................. 517 5.2
Total off-balance sheet Private Education Loans in repayment . . ............ 9,987 100%
Total off-balance sheet Private Education Loans, gross ..................... $12,986
(1) Loans for borrowers who may still be attending school or engaging in other permitted educational activities and are not yet
required to make payments on the loans, e.g., residency periods for medical students or a grace period for bar exam
preparation.
(2) Loans for borrowers who have requested extension of grace period generally during employment transition or who have tempo-
rarily ceased making full payments due to hardship or other factors, consistent with the established loan program servicing poli-
cies and procedures.
(3) The period of delinquency is based on the number of days scheduled payments are contractually past due.
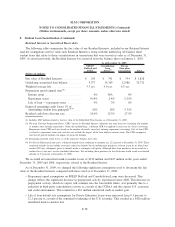
The following table summarizes charge-off activity for Private Education Loans in the off-balance sheet
trusts for the years ended December 31, 2009 and 2008.
2009 2008
Year Ended
December 31,
(Dollars in millions)
Charge-offs .................................................. $ (423) $ (153)
Charge-offs as a percentage of average loans in repayment ............... 4.4% 1.9%
Charge-offs as a percentage of average loans in repayment and forbearance . . . 4.2% 1.6%
Ending off-balance sheet total Private Education Loans
(1)
................ $13,215 $13,782
Average off-balance sheet Private Education Loans in repayment ........... $ 9,597 $ 8,088
Ending off-balance sheet Private Education Loans in repayment ............ $ 9,987 $ 9,530
(1) Ending total loans represents gross Private Education Loans, plus the receivable for partially charged-off loans (see Note 4,
“Allowance for Loan Losses”).
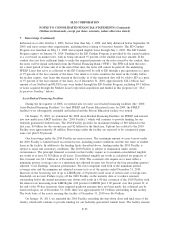
9. Derivative Financial Instruments
Risk Management Strategy
We maintain an overall interest rate risk management strategy that incorporates the use of derivative
instruments to minimize the economic effect of interest rate changes. Our goal is to manage interest rate
F-59
SLM CORPORATION
NOTES TO CONSOLIDATED FINANCIAL STATEMENTS (Continued)
(Dollars in thousands, except per share amounts, unless otherwise stated)