Sallie Mae 2010 Annual Report Download - page 53
Download and view the complete annual report
Please find page 53 of the 2010 Sallie Mae annual report below. You can navigate through the pages in the report by either clicking on the pages listed below, or by using the keyword search tool below to find specific information within the annual report.
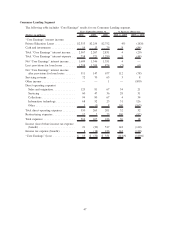
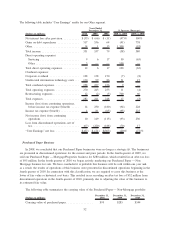
The following table includes “Core Earnings” results for our Other segment.
(Dollars in millions) 2010 2009 2008 2010 vs. 2009 2009 vs. 2008
Years Ended
December 31, % Increase (Decrease)
Net interest loss after provision........... $(35) $ (66) $ (11) (47)% 500%
Gains on debt repurchases .............. 317 536 64 (41) 738
Other .............................. 14 1 15 1,300 (93)
Total income . . ...................... 331 537 79 (38) 580
Direct operating expenses:
Servicing . . . ...................... 9 6 17 50 (65)
Other ............................ 3 — — 100 —
Total direct operating expenses ........... 12 6 17 100 (65)
Overhead expenses:
Corporate overhead ................... 128 138 150 (7) (8)
Unallocated information technology costs . . . 130 99 86 31 15
Total overhead expenses ................ 258 237 236 9 —
Total operating expenses................ 270 243 253 11 (4)
Restructuring expenses ................. 12 (2) (5) 700 60
Total expenses . ...................... 282 241 248 17 (3)
Income (loss) from continuing operations,
before income tax expense (benefit) ..... 14 230 (180) (94) 228
Income tax expense (benefit) ............ 4 81 (65) (95) 225
Net income (loss) from continuing
operations. . . ...................... 10 149 (115) (93) 230
Loss from discontinued operations, net of
tax.............................. (67) (220) (188) (70) 17
“Core Earnings” net loss ............... $(57) $ (71) $(303) (20)% (77)%
Purchased Paper Business
In 2008, we concluded that our Purchased Paper businesses were no longer a strategic fit. The businesses
are presented in discontinued operations for the current and prior periods. In the fourth quarter of 2009, we
sold our Purchased Paper — Mortgage/Properties business for $280 million, which resulted in an after-tax loss
of $95 million. In the fourth quarter of 2010 we began actively marketing our Purchased Paper — Non
Mortgage business for sale. We have concluded it is probable this business will be sold within one year and,
as a result, the results of operations of this business were presented in discontinued operations beginning in the
fourth quarter of 2010. In connection with this classification, we are required to carry this business at the
lower of fair value or historical cost basis. This resulted in us recording an after-tax loss of $52 million from
discontinued operations in the fourth quarter of 2010, primarily due to adjusting the value of this business to
its estimated fair value.
The following table summarizes the carrying value of the Purchased Paper — Non-Mortgage portfolio:
(Dollars in millions)
December 31,
2010
December 31,
2009
December 31,
2008
Carrying value of purchased paper ................. $95 $285 $544
52


