Sallie Mae 2010 Annual Report Download - page 144
Download and view the complete annual report
Please find page 144 of the 2010 Sallie Mae annual report below. You can navigate through the pages in the report by either clicking on the pages listed below, or by using the keyword search tool below to find specific information within the annual report.-
 1
1 -
2
-
3
-
4
-
5
-
6
-
7
-
8
-
9
-
10
-
11
-
12
-
13
-
14
-
15
-
16
-
17
-
18
-
19
-
20
-
21
-
22
-
23
-
24
-
25
-
26
-
27
-
28
-
29
-
30
-
31
-
32
-
33
-
34
-
35
-
36
-
37
-
38
-
39
-
40
-
41
-
42
-
43
-
44
-
45
-
46
-
47
-
48
-
49
-
50
-
51
-
52
-
53
-
54
-
55
-
56
-
57
-
58
-
59
-
60
-
61
-
62
-
63
-
64
-
65
-
66
-
67
-
68
-
69
-
70
-
71
-
72
-
73
-
74
-
75
-
76
-
77
-
78
-
79
-
80
-
81
-
82
-
83
-
84
-
85
-
86
-
87
-
88
-
89
-
90
-
91
-
92
-
93
-
94
-
95
-
96
-
97
-
98
-
99
-
100
-
101
-
102
-
103
-
104
-
105
-
106
-
107
-
108
-
109
-
110
-
111
-
112
-
113
-
114
-
115
-
116
-
117
-
118
-
119
-
120
-
121
-
122
-
123
-
124
-
125
-
126
-
127
-
128
-
129
-
130
-
131
-
132
-
133
-
 134
134 -
 135
135 -
 136
136 -
 137
137 -
 138
138 -
 139
139 -
 140
140 -
 141
141 -
 142
142 -
 143
143 -
 144
144 -
 145
145 -
 146
146 -
 147
147 -
 148
148 -
 149
149 -
 150
150 -
 151
151 -
 152
152 -
 153
153 -
 154
154 -
155
-
156
-
157
-
158
-
159
-
160
-
161
-
162
-
163
-
164
-
165
-
166
-
167
-
168
-
169
-
170
-
171
-
172
-
173
-
174
-
175
-
176
-
177
-
178
-
179
-
180
-
181
-
182
-
183
-
184
-
185
-
186
-
187
-
188
-
189
-
190
-
191
-
192
-
193
-
194
-
195
-
196
-
197
-
198
-
199
-
200
-
201
-
202
-
203
-
204
-
205
-
206
-
207
-
208
-
209
-
210
-
211
-
212
-
213
-
214
-
215
-
216
-
217
-
218
-
219
-
220
-
221
-
222
-
223
-
224
-
225
-
226
 |
 |

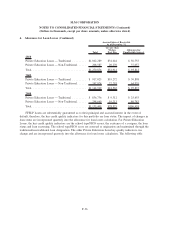
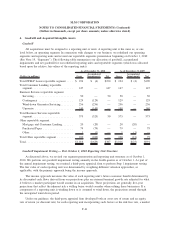
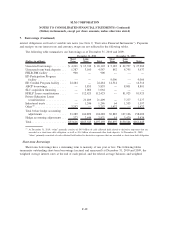
6. Goodwill and Acquired Intangible Assets
Goodwill
All acquisitions must be assigned to a reporting unit or units. A reporting unit is the same as, or one
level below, an operating segment. In connection with changes to our business, we redefined our operating
segments and reporting units and revised our reportable segments presentation beginning on October 1, 2010
(See Note 19, “Segments”). The following table summarizes our allocation of goodwill, accumulated
impairments and net goodwill for our redefined reporting units and reportable segments (which was allocated
based upon the relative fair values of the reporting units).
(Dollars in millions) Gross
Accumulated
Impairments Net Gross
Accumulated
Impairments Net
As of December 31, 2010 As of December 31, 2009
Total FFELP Loans reportable segment .... $ 194 $ (4) $190 $ 194 $ (4) $190
Total Consumer Lending reportable
segment.......................... 147 — 147 147 — 147
Business Services reportable segment
Servicing ......................... 50 — 50 50 — 50
Contingency . ..................... 129 (129) — 129 — 129
Wind-down Guarantor Servicing........ 256 (256) — 256 — 256
Upromise . . . ..................... 140 (140) — 140 — 140
Total Business Services reportable
segment.......................... 575 (525) 50 575 — 575
Other reportable segment
Mortgage and Consumer Lending ....... 20 (20) — 20 (20) —
Purchased Paper ................... 79 (79) — 79 — 79
Other............................ 1 (1) — 1 (1) —
Total Other reportable segment .......... 100 (100) — 100 (21) 79
Total .............................. $1,016 $(629) $387 $1,016 $(25) $991
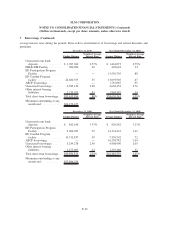
Goodwill Impairment Testing — Post October 1, 2010 Reporting Unit Structure
As discussed above, we revised our segment presentation and reporting unit structure as of October 1,
2010. We perform our goodwill impairment testing annually in the fourth quarter as of October 1. As part of
the annual impairment testing, we retained a third-party appraisal firm to perform Step 1 impairment testing.
The fair value of each reporting unit was determined by weighting different valuation approaches, as
applicable, with the primary approach being the income approach.
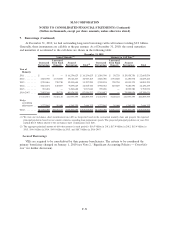
The income approach measures the value of each reporting unit’s future economic benefit determined by
its discounted cash flows derived from our projections plus an assumed terminal growth rate adjusted for what
it believes a market participant would assume in an acquisition. These projections are generally five-year
projections that reflect the inherent risk a willing buyer would consider when valuing these businesses. If a
component of a reporting unit is winding down or is assumed to wind down, the projections extend through
the anticipated wind down period.
Under our guidance, the third-party appraisal firm developed both an asset rate of return and an equity
rate of return (or discount rate) for each reporting unit incorporating such factors as the risk free rate, a market
F-41
SLM CORPORATION
NOTES TO CONSOLIDATED FINANCIAL STATEMENTS (Continued)
(Dollars in thousands, except per share amounts, unless otherwise stated)