Sallie Mae 2010 Annual Report Download - page 62
Download and view the complete annual report
Please find page 62 of the 2010 Sallie Mae annual report below. You can navigate through the pages in the report by either clicking on the pages listed below, or by using the keyword search tool below to find specific information within the annual report.-
 1
1 -
2
-
3
-
4
-
5
-
6
-
7
-
8
-
9
-
10
-
11
-
12
-
13
-
14
-
15
-
16
-
17
-
18
-
19
-
20
-
21
-
22
-
23
-
24
-
25
-
26
-
27
-
28
-
29
-
30
-
31
-
32
-
33
-
34
-
35
-
36
-
37
-
38
-
39
-
40
-
41
-
42
-
43
-
44
-
45
-
46
-
47
-
48
-
49
-
50
-
51
-
 52
52 -
 53
53 -
 54
54 -
 55
55 -
 56
56 -
 57
57 -
 58
58 -
 59
59 -
 60
60 -
 61
61 -
 62
62 -
 63
63 -
 64
64 -
 65
65 -
 66
66 -
 67
67 -
 68
68 -
 69
69 -
 70
70 -
 71
71 -
 72
72 -
73
-
74
-
75
-
76
-
77
-
78
-
79
-
80
-
81
-
82
-
83
-
84
-
85
-
86
-
87
-
88
-
89
-
90
-
91
-
92
-
93
-
94
-
95
-
96
-
97
-
98
-
99
-
100
-
101
-
102
-
103
-
104
-
105
-
106
-
107
-
108
-
109
-
110
-
111
-
112
-
113
-
114
-
115
-
116
-
117
-
118
-
119
-
120
-
121
-
122
-
123
-
124
-
125
-
126
-
127
-
128
-
129
-
130
-
131
-
132
-
133
-
134
-
135
-
136
-
137
-
138
-
139
-
140
-
141
-
142
-
143
-
144
-
145
-
146
-
147
-
148
-
149
-
150
-
151
-
152
-
153
-
154
-
155
-
156
-
157
-
158
-
159
-
160
-
161
-
162
-
163
-
164
-
165
-
166
-
167
-
168
-
169
-
170
-
171
-
172
-
173
-
174
-
175
-
176
-
177
-
178
-
179
-
180
-
181
-
182
-
183
-
184
-
185
-
186
-
187
-
188
-
189
-
190
-
191
-
192
-
193
-
194
-
195
-
196
-
197
-
198
-
199
-
200
-
201
-
202
-
203
-
204
-
205
-
206
-
207
-
208
-
209
-
210
-
211
-
212
-
213
-
214
-
215
-
216
-
217
-
218
-
219
-
220
-
221
-
222
-
223
-
224
-
225
-
226
 |
 |

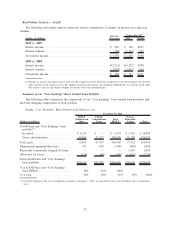
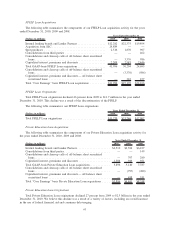
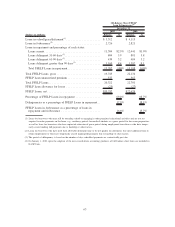
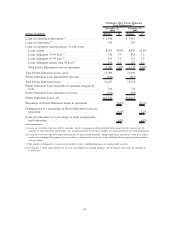
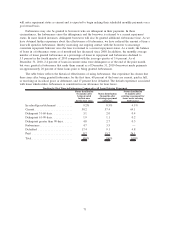
FFELP Loan Acquisitions
The following table summarizes the components of our FFELP Loan acquisition activity for the years
ended December 31, 2010, 2009 and 2008.
(Dollars in millions) 2010 2009 2008
Years Ended December 31
Internal lending brands and Lender Partners .................. $12,282 $22,375 $19,894
Acquisition from SLC .................................. 24,889 — —
Spot purchases ....................................... 2,516 1,870 907
Consolidations from third parties .......................... — — 462
Consolidations and clean-up calls of off-balance sheet securitized
loans ............................................. — 3,376 986
Capitalized interest, premiums and discounts ................. 2,309 2,583 2,446
Total GAAP-basis FFELP Loan acquisitions .................. 41,996 30,204 24,695
Consolidations and clean-up calls of off-balance sheet securitized
loans ............................................. — (3,376) (986)
Capitalized interest, premiums and discounts — off-balance sheet
securitized loans .................................... — 342 457
Total “Core Earnings” basis FFELP Loan acquisitions .......... $41,996 $27,170 $24,166
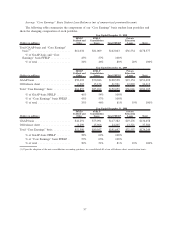
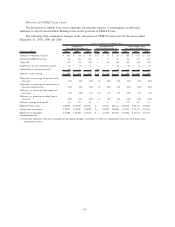
FFELP Loan Originations
Total FFELP Loan originations declined 46 percent from 2009 to $11.7 million in the year ended
December 31, 2010. This decline was a result of the discontinuation of the FFELP.
The following table summarizes our FFELP Loan originations.
(Dollars in millions) 2010 2009 2008
Years Ended December 31,
Total FFELP Loan originations ........................... $11,720 $21,746 $17,907
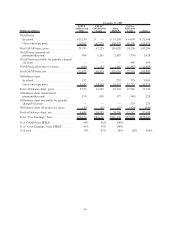
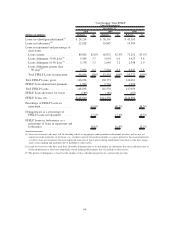
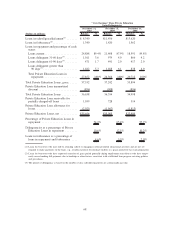
Private Education Loan Acquisitions
The following table summarizes the components of our Private Education Loan acquisition activity for
the years ended December 31, 2010, 2009 and 2008.
(Dollars in millions) 2010 2009 2008
Years Ended December 31
Internal lending brands and Lender Partners . . ................... $2,510 $3,394 $6,437
Consolidations from third parties ............................. — — 149
Consolidations and clean-up calls of off-balance sheet securitized
loans ................................................ — 797 280
Capitalized interest, premiums and discounts . ................... 1,386 949 921
Total GAAP-basis Private Education Loan acquisitions............. 3,896 5,140 7,787
Consolidations and clean-up calls of off-balance sheet securitized
loans ................................................ — (797) (280)
Capitalized interest, premiums and discounts — off-balance sheet
securitized loans ....................................... — 498 741
Total “Core Earnings” basis Private Education Loan acquisitions ..... $3,896 $4,841 $8,248
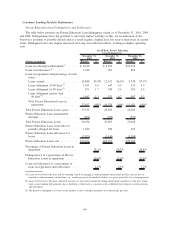
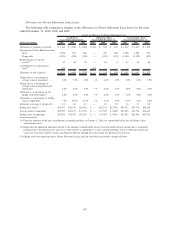
Private Education Loan Originations
Total Private Education Loan originations declined 27 percent from 2009 to $2.3 billion in the year ended
December 31, 2010. We believe this decline was a result of a variety of factors, including an overall increase
in the use of federal financial aid and consumer deleveraging.
61