Sallie Mae 2010 Annual Report Download - page 45
Download and view the complete annual report
Please find page 45 of the 2010 Sallie Mae annual report below. You can navigate through the pages in the report by either clicking on the pages listed below, or by using the keyword search tool below to find specific information within the annual report.-
 1
1 -
2
-
3
-
4
-
5
-
6
-
7
-
8
-
9
-
10
-
11
-
12
-
13
-
14
-
15
-
16
-
17
-
18
-
19
-
20
-
21
-
22
-
23
-
24
-
25
-
26
-
27
-
28
-
29
-
30
-
31
-
32
-
33
-
34
-
 35
35 -
 36
36 -
 37
37 -
 38
38 -
 39
39 -
 40
40 -
 41
41 -
 42
42 -
 43
43 -
 44
44 -
 45
45 -
 46
46 -
 47
47 -
 48
48 -
 49
49 -
 50
50 -
 51
51 -
 52
52 -
 53
53 -
 54
54 -
 55
55 -
56
-
57
-
58
-
59
-
60
-
61
-
62
-
63
-
64
-
65
-
66
-
67
-
68
-
69
-
70
-
71
-
72
-
73
-
74
-
75
-
76
-
77
-
78
-
79
-
80
-
81
-
82
-
83
-
84
-
85
-
86
-
87
-
88
-
89
-
90
-
91
-
92
-
93
-
94
-
95
-
96
-
97
-
98
-
99
-
100
-
101
-
102
-
103
-
104
-
105
-
106
-
107
-
108
-
109
-
110
-
111
-
112
-
113
-
114
-
115
-
116
-
117
-
118
-
119
-
120
-
121
-
122
-
123
-
124
-
125
-
126
-
127
-
128
-
129
-
130
-
131
-
132
-
133
-
134
-
135
-
136
-
137
-
138
-
139
-
140
-
141
-
142
-
143
-
144
-
145
-
146
-
147
-
148
-
149
-
150
-
151
-
152
-
153
-
154
-
155
-
156
-
157
-
158
-
159
-
160
-
161
-
162
-
163
-
164
-
165
-
166
-
167
-
168
-
169
-
170
-
171
-
172
-
173
-
174
-
175
-
176
-
177
-
178
-
179
-
180
-
181
-
182
-
183
-
184
-
185
-
186
-
187
-
188
-
189
-
190
-
191
-
192
-
193
-
194
-
195
-
196
-
197
-
198
-
199
-
200
-
201
-
202
-
203
-
204
-
205
-
206
-
207
-
208
-
209
-
210
-
211
-
212
-
213
-
214
-
215
-
216
-
217
-
218
-
219
-
220
-
221
-
222
-
223
-
224
-
225
-
226
 |
 |

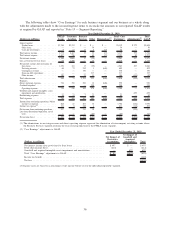
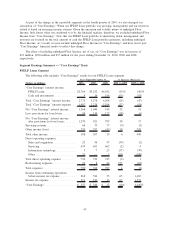
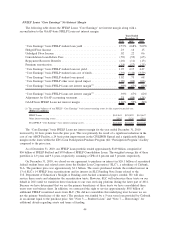
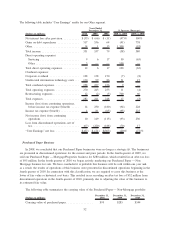
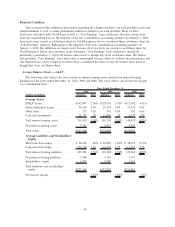
FFELP Loans “Core Earnings” Net Interest Margin
The following table shows the FFELP Loans “Core Earnings” net interest margin along with a
reconciliation to the GAAP-basis FFELP Loans net interest margin.
2010 2009 2008
Years Ended
December 31,
“Core Earnings” basis FFELP student loan yield ..................... 2.57% 2.68% 5.09%
Hedged Floor Income ......................................... .23 .14 .15
Unhedged Floor Income ....................................... .02 .22 .06
Consolidation Loan Rebate Fees ................................. (.59) (.59) (.65)
Repayment Borrower Benefits ................................... (.10) (.11) (.13)
Premium amortization ......................................... (.18) (.17) (.25)
“Core Earnings” basis FFELP student loan net yield ................... 1.95 2.17 4.27
“Core Earnings” basis FFELP student loan cost of funds................ (.93) (1.44) (3.59)
“Core Earnings” basis FFELP student loan spread .................... 1.02 .73 .68
“Core Earnings” basis FFELP other asset spread impact ................ (.09) (.06) (.06)
“Core Earnings” basis FFELP Loans net interest margin
(1)
.............. .93% .67% .62%
“Core Earnings” basis FFELP Loans net interest margin
(1)
.............. .93% .67% .62%
Adjustment for GAAP accounting treatment ......................... .33 (.08) (.28)
GAAP-basis FFELP Loans net interest margin ....................... 1.26% .59% .34%
(1) The average balances of our FFELP “Core Earnings” basis interest-earning assets for the respective periods are:
(Dollars in millions)
FFELP Loans ................................................ $142,043 $150,059 $141,647
Other interest-earning assets . ...................................... 5,562 5,126 5,501
Total FFELP “Core Earnings” basis interest-earning assets . .................. $147,605 $155,185 $147,148
The “Core Earnings” basis FFELP Loans net interest margin for the year ended December 31, 2010
increased by 26 basis points from the prior year. This was primarily the result of a significant reduction in the
cost of our ABCP Facility, a 24 basis point improvement in the CP/LIBOR Spread and a significantly higher
margin on the loans within the ED’s Loan Participation Purchase Program (the “Participation Program”) facility
compared to the prior year.
As of December 31, 2010, our FFELP Loan portfolio totaled approximately $149 billion, comprised of
$56 billion of FFELP Stafford and $93 billion of FFELP Consolidation Loans. The weighted average life of these
portfolios is 4.9 years and 9.4 years, respectively, assuming a CPR of 6 percent and 3 percent, respectively.
On December 31, 2010, we closed on our agreement to purchase an interest in $26.1 billion of securitized
federal student loans and related assets from the Student Loan Corporation (“SLC”), a subsidiary of Citibank,
N.A. The purchase price was approximately $1.1 billion. The assets purchased include the residual interest in
13 of SLC’s 14 FFELP loan securitizations and its interest in SLC Funding Note Issuer related to the
U.S. Department of Education’s Straight-A Funding asset-backed commercial paper conduit. We will also
service these assets and administer the securitization trusts. However, SLC will subservice these trusts on our
behalf in 2011 until we transition these functions to our own servicing platform during the latter part of 2011.
Because we have determined that we are the primary beneficiary of these trusts we have consolidated these
trusts onto our balance sheet. In addition, we contracted the right to service approximately $0.8 billion of
additional FFELP securitized assets from SLC. (We did not consolidate this underlying trust because we are
not the primary beneficiary of this trust.) The purchase was funded by a 5-year term loan provided by Citibank
in an amount equal to the purchase price. See “Note 3 — Student Loans” and “Note 7 — Borrowings” for
additional details regarding assets and terms of funding.
44