Sallie Mae 2010 Annual Report Download - page 195
Download and view the complete annual report
Please find page 195 of the 2010 Sallie Mae annual report below. You can navigate through the pages in the report by either clicking on the pages listed below, or by using the keyword search tool below to find specific information within the annual report.-
 1
1 -
2
-
3
-
4
-
5
-
6
-
7
-
8
-
9
-
10
-
11
-
12
-
13
-
14
-
15
-
16
-
17
-
18
-
19
-
20
-
21
-
22
-
23
-
24
-
25
-
26
-
27
-
28
-
29
-
30
-
31
-
32
-
33
-
34
-
35
-
36
-
37
-
38
-
39
-
40
-
41
-
42
-
43
-
44
-
45
-
46
-
47
-
48
-
49
-
50
-
51
-
52
-
53
-
54
-
55
-
56
-
57
-
58
-
59
-
60
-
61
-
62
-
63
-
64
-
65
-
66
-
67
-
68
-
69
-
70
-
71
-
72
-
73
-
74
-
75
-
76
-
77
-
78
-
79
-
80
-
81
-
82
-
83
-
84
-
85
-
86
-
87
-
88
-
89
-
90
-
91
-
92
-
93
-
94
-
95
-
96
-
97
-
98
-
99
-
100
-
101
-
102
-
103
-
104
-
105
-
106
-
107
-
108
-
109
-
110
-
111
-
112
-
113
-
114
-
115
-
116
-
117
-
118
-
119
-
120
-
121
-
122
-
123
-
124
-
125
-
126
-
127
-
128
-
129
-
130
-
131
-
132
-
133
-
134
-
135
-
136
-
137
-
138
-
139
-
140
-
141
-
142
-
143
-
144
-
145
-
146
-
147
-
148
-
149
-
150
-
151
-
152
-
153
-
154
-
155
-
156
-
157
-
158
-
159
-
160
-
161
-
162
-
163
-
164
-
165
-
166
-
167
-
168
-
169
-
170
-
171
-
172
-
173
-
174
-
175
-
176
-
177
-
178
-
179
-
180
-
181
-
182
-
183
-
184
-
 185
185 -
 186
186 -
 187
187 -
 188
188 -
 189
189 -
 190
190 -
 191
191 -
 192
192 -
 193
193 -
 194
194 -
 195
195 -
 196
196 -
 197
197 -
 198
198 -
 199
199 -
 200
200 -
 201
201 -
 202
202 -
 203
203 -
 204
204 -
 205
205 -
206
-
207
-
208
-
209
-
210
-
211
-
212
-
213
-
214
-
215
-
216
-
217
-
218
-
219
-
220
-
221
-
222
-
223
-
224
-
225
-
226
 |
 |

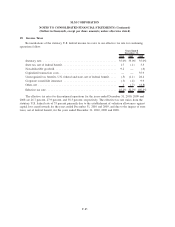
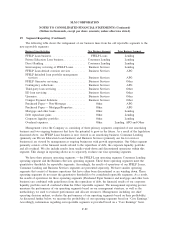
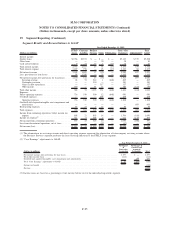
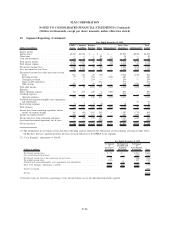
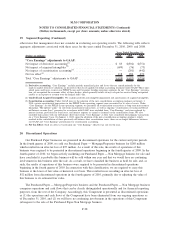
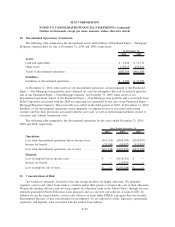
19. Segment Reporting (Continued)
The following table includes asset information for our Consumer Lending segment.
2010 2009
December 31,
Private Education Loans, net ...................................... $35,656 $22,753
Cash and investments
(1)
......................................... 3,372 3,459
Retained Interest in off-balance sheet securitized loans .................. — 794
Other ....................................................... 4,004 3,729
Total assets .................................................. $43,032 $30,735
(1) Includes restricted cash and investments.
The significant increase in assets is primarily the result of the new consolidation accounting guidance
which required us to consolidate off-balance sheet trust assets onto the balance sheet.
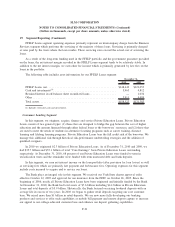
Business Services Segment
The Business Services segment generates its revenue from servicing our FFELP Loan portfolio as well as
servicing FFELP and other loans for other financial institutions, guarantors and ED. The segment also
performs default aversion work and contingency collections on behalf of Guarantors and ED, Campus Payment
Solutions, account asset servicing and transaction processing activities. We are the largest servicer of student
loans, the largest collector of defaulted student loans, the largest administrator of 529 college-savings plans
and saving for college loyalty programs, and we have a growing Campus Payment Solutions platform.
The segment generates revenue from servicing FFELP Loans owned and managed by us. These revenues
are intercompany charges to the FFELP Loans segment and are primarily charged at rates paid by the trusts
where the loans reside. These fees are contractually designated as the first payment from the trust cash flows.
These fees are high quality in terms of both their priority and predictability and exceed the actual cost of
servicing the loans. Revenue is also generated by servicing third-party loans for other financial institutions and
ED.
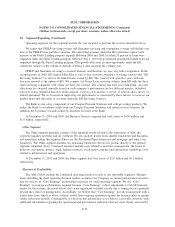
We generate revenue by servicing FFELP Loans for Guarantors. We earn an account maintenance fee on
a portfolio of $99 billion of FFELP Loans for 9 Guarantors. We provide a full complement of default aversion
and default collection services on a contingency or pay for performance basis to 13 Guarantors, campus-based
programs and ED. We have performed default collection work for over ten years and have consistently been a
top performer.
Our Upromise Investments subsidiary generates revenue by providing program management services for
529 college-savings plans with assets of $34.5 billion in 32 college savings plans in 16 states. We also
generate revenue in the form of transaction fees generated by our consumer savings network, through which
members have earned $600 million in rewards by purchasing products at hundreds of online retailers, booking
travel, purchasing a home, dining out, buying gas and groceries, by using the Upromise World Master Card
and completing qualified transactions. We earn a fee for providing the marketing and administrative services
we provide to companies that participate in the Upromise savings network.
Finally, our Campus Payment Solutions business offers a suite of solutions designed to help campus
business offices increase their services to students and families. The product suite includes electronic billing,
collection, payment and refund services plus full tuition payment plan administration. In 2010, we generated
servicing revenue from over 1,100 schools.
F-92
SLM CORPORATION
NOTES TO CONSOLIDATED FINANCIAL STATEMENTS (Continued)
(Dollars in thousands, except per share amounts, unless otherwise stated)