Sallie Mae 2010 Annual Report Download - page 71
Download and view the complete annual report
Please find page 71 of the 2010 Sallie Mae annual report below. You can navigate through the pages in the report by either clicking on the pages listed below, or by using the keyword search tool below to find specific information within the annual report.-
 1
1 -
2
-
3
-
4
-
5
-
6
-
7
-
8
-
9
-
10
-
11
-
12
-
13
-
14
-
15
-
16
-
17
-
18
-
19
-
20
-
21
-
22
-
23
-
24
-
25
-
26
-
27
-
28
-
29
-
30
-
31
-
32
-
33
-
34
-
35
-
36
-
37
-
38
-
39
-
40
-
41
-
42
-
43
-
44
-
45
-
46
-
47
-
48
-
49
-
50
-
51
-
52
-
53
-
54
-
55
-
56
-
57
-
58
-
59
-
60
-
 61
61 -
 62
62 -
 63
63 -
 64
64 -
 65
65 -
 66
66 -
 67
67 -
 68
68 -
 69
69 -
 70
70 -
 71
71 -
 72
72 -
 73
73 -
 74
74 -
 75
75 -
 76
76 -
 77
77 -
 78
78 -
 79
79 -
 80
80 -
 81
81 -
82
-
83
-
84
-
85
-
86
-
87
-
88
-
89
-
90
-
91
-
92
-
93
-
94
-
95
-
96
-
97
-
98
-
99
-
100
-
101
-
102
-
103
-
104
-
105
-
106
-
107
-
108
-
109
-
110
-
111
-
112
-
113
-
114
-
115
-
116
-
117
-
118
-
119
-
120
-
121
-
122
-
123
-
124
-
125
-
126
-
127
-
128
-
129
-
130
-
131
-
132
-
133
-
134
-
135
-
136
-
137
-
138
-
139
-
140
-
141
-
142
-
143
-
144
-
145
-
146
-
147
-
148
-
149
-
150
-
151
-
152
-
153
-
154
-
155
-
156
-
157
-
158
-
159
-
160
-
161
-
162
-
163
-
164
-
165
-
166
-
167
-
168
-
169
-
170
-
171
-
172
-
173
-
174
-
175
-
176
-
177
-
178
-
179
-
180
-
181
-
182
-
183
-
184
-
185
-
186
-
187
-
188
-
189
-
190
-
191
-
192
-
193
-
194
-
195
-
196
-
197
-
198
-
199
-
200
-
201
-
202
-
203
-
204
-
205
-
206
-
207
-
208
-
209
-
210
-
211
-
212
-
213
-
214
-
215
-
216
-
217
-
218
-
219
-
220
-
221
-
222
-
223
-
224
-
225
-
226
 |
 |

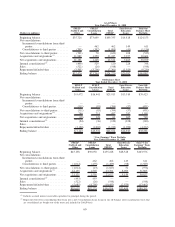
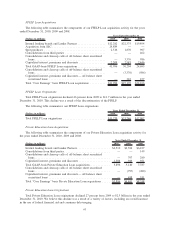
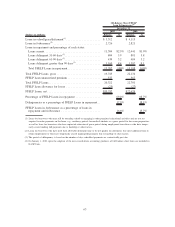
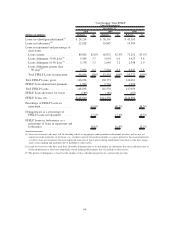
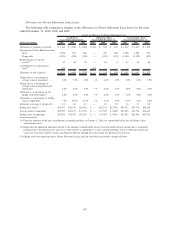
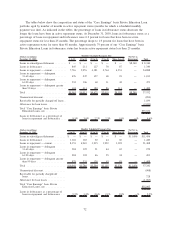
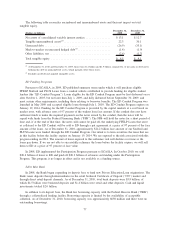
The following table provides the detail for our traditional and non-traditional “Core Earnings” basis
Private Education Loans at December 31, 2010, 2009 and 2008.
(Dollars in millions) Traditional
Non-
Traditional Total Traditional
Non-
Traditional Total Traditional
Non-
Traditional Total
December 31, 2010 December 31, 2009 December 31, 2008
Ending total loans
(1)
....... $34,177 $4,395 $38,572 $33,223 $4,747 $37,970 $31,101 $5,107 $36,208
Ending loans in repayment . . . 25,043 2,809 27,852 21,453 2,913 24,366 17,715 2,997 20,712
Private Education Loan
allowance for losses . . .... 1,231 790 2,021 1,056 911 1,967 859 954 1,813
Charge-offs as a percentage of
average loans in
repayment . . . ......... 3.6% 16.8% 5.0% 3.6% 21.4% 6.0% 1.4% 11.1% 2.9%
Allowance as a percentage of
ending total loan
balance
(1)
............. 3.6% 18.0% 5.2% 3.2% 19.2% 5.2% 2.8% 18.7% 5.0%
Allowance as a percentage of
ending loans in repayment . . 4.9% 28.2% 7.3% 4.9% 31.3% 8.1% 4.8% 31.8% 8.8%
Allowance coverage of charge-
offs................. 1.5 1.7 1.6 1.6 1.5 1.5 4.2 3.5 3.8
Delinquencies as a percentage
of Private Education Loans
in repayment. . ......... 8.8% 27.4% 10.6% 9.5% 31.4% 12.1% 7.1% 28.9% 10.2%
Delinquencies greater than
90 days as a percentage of
Private Education Loans in
repayment . . . ......... 4.2% 15.0% 5.3% 4.6% 17.5% 6.1% 2.6% 12.7% 4.0%
Loans in forbearance as a
percentage of loans in
repayment and
forbearance . . ......... 4.4% 6.1% 4.6% 5.3% 7.1% 5.5% 6.7% 9.0% 7.0%
Percentage of Private
Education Loans with a
cosigner .............. 63% 28% 59% 61% 28% 57% 59% 26% 55%
Average FICO at origination . . 725 623 715 725 623 713 723 622 710
(1) Ending total loans represents gross Private Education Loans, plus the receivable for partially charged-off loans.
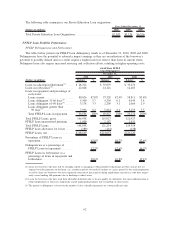
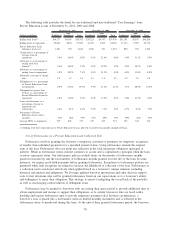
Use of Forbearance as a Private Education Loan Collection Tool
Forbearance involves granting the borrower a temporary cessation of payments (or temporary acceptance
of smaller than scheduled payments) for a specified period of time. Using forbearance extends the original
term of the loan. Forbearance does not grant any reduction in the total repayment obligation (principal or
interest). While in forbearance status, interest continues to accrue and is capitalized to principal when the loan
re-enters repayment status. Our forbearance policies include limits on the number of forbearance months
granted consecutively and the total number of forbearance months granted over the life of the loan. In some
instances, we require good-faith payments before granting forbearance. Exceptions to forbearance policies are
permitted when such exceptions are judged to increase the likelihood of collection of the loan. Forbearance as
a collection tool is used most effectively when applied based on a borrower’s unique situation, including
historical information and judgments. We leverage updated borrower information and other decision support
tools to best determine who will be granted forbearance based on our expectations as to a borrower’s ability
and willingness to repay their obligation. This strategy is aimed at mitigating the overall risk of the portfolio
as well as encouraging cash resolution of delinquent loans.
Forbearance may be granted to borrowers who are exiting their grace period to provide additional time to
obtain employment and income to support their obligations, or to current borrowers who are faced with a
hardship and request forbearance time to provide temporary payment relief. In these circumstances, a
borrower’s loan is placed into a forbearance status in limited monthly increments and is reflected in the
forbearance status at month-end during this time. At the end of their granted forbearance period, the borrower
70