Sallie Mae 2010 Annual Report Download - page 149
Download and view the complete annual report
Please find page 149 of the 2010 Sallie Mae annual report below. You can navigate through the pages in the report by either clicking on the pages listed below, or by using the keyword search tool below to find specific information within the annual report.-
 1
1 -
2
-
3
-
4
-
5
-
6
-
7
-
8
-
9
-
10
-
11
-
12
-
13
-
14
-
15
-
16
-
17
-
18
-
19
-
20
-
21
-
22
-
23
-
24
-
25
-
26
-
27
-
28
-
29
-
30
-
31
-
32
-
33
-
34
-
35
-
36
-
37
-
38
-
39
-
40
-
41
-
42
-
43
-
44
-
45
-
46
-
47
-
48
-
49
-
50
-
51
-
52
-
53
-
54
-
55
-
56
-
57
-
58
-
59
-
60
-
61
-
62
-
63
-
64
-
65
-
66
-
67
-
68
-
69
-
70
-
71
-
72
-
73
-
74
-
75
-
76
-
77
-
78
-
79
-
80
-
81
-
82
-
83
-
84
-
85
-
86
-
87
-
88
-
89
-
90
-
91
-
92
-
93
-
94
-
95
-
96
-
97
-
98
-
99
-
100
-
101
-
102
-
103
-
104
-
105
-
106
-
107
-
108
-
109
-
110
-
111
-
112
-
113
-
114
-
115
-
116
-
117
-
118
-
119
-
120
-
121
-
122
-
123
-
124
-
125
-
126
-
127
-
128
-
129
-
130
-
131
-
132
-
133
-
134
-
135
-
136
-
137
-
138
-
 139
139 -
 140
140 -
 141
141 -
 142
142 -
 143
143 -
 144
144 -
 145
145 -
 146
146 -
 147
147 -
 148
148 -
 149
149 -
 150
150 -
 151
151 -
 152
152 -
 153
153 -
 154
154 -
 155
155 -
 156
156 -
 157
157 -
 158
158 -
 159
159 -
160
-
161
-
162
-
163
-
164
-
165
-
166
-
167
-
168
-
169
-
170
-
171
-
172
-
173
-
174
-
175
-
176
-
177
-
178
-
179
-
180
-
181
-
182
-
183
-
184
-
185
-
186
-
187
-
188
-
189
-
190
-
191
-
192
-
193
-
194
-
195
-
196
-
197
-
198
-
199
-
200
-
201
-
202
-
203
-
204
-
205
-
206
-
207
-
208
-
209
-
210
-
211
-
212
-
213
-
214
-
215
-
216
-
217
-
218
-
219
-
220
-
221
-
222
-
223
-
224
-
225
-
226
 |
 |

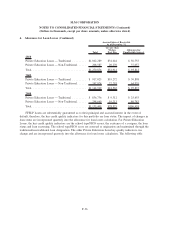
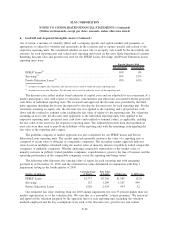
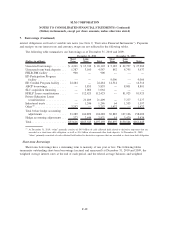
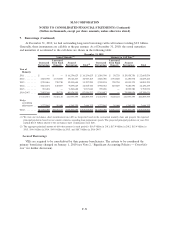
6. Goodwill and Acquired Intangible Assets (Continued)
The following table illustrates the book basis of equity for each reporting unit and the estimated fair
value determined in conjunction with Step 1 impairment testing in the fourth quarter of 2009.
(Dollars in millions)
Carrying Value
of Equity
Fair Value
of Equity $ Difference % Difference
Lending ........................... $1,474 $3,270 $1,796 122%
APG ............................. 1,390 1,690 300 22
Guarantor Servicing .................. 142 221 79 56
Upromise .......................... 297 430 133 45
We reviewed and approved the valuation prepared by the appraisal firm for each reporting unit in the
fourth quarter of 2009, including the valuation methods employed and the key assumptions used, such as the
discount rates, growth rates and control premiums, as applicable, for each reporting unit. We also performed
stress tests of key assumptions using a range of discount rates and growth rates, as applicable. Based on the
valuations performed in conjunction with Step 1 impairment testing and these stress tests, there was no
indicated impairment for any reporting units at October 1, 2009,
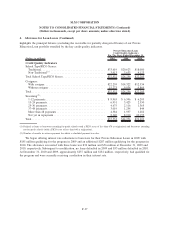
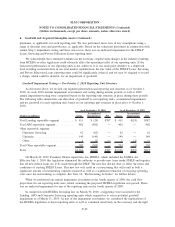
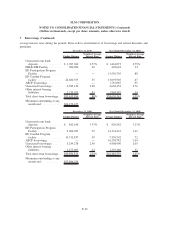
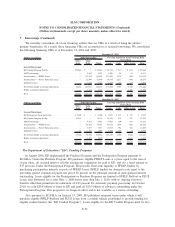
Acquired Intangible Assets
Acquired intangible assets include the following:
(Dollars in millions)
Average
Amortization
Period
Cost
Basis
(1)
Accumulated
Impairment and
Amortization
(1)
Net
As of December 31, 2010
Intangible assets subject to amortization:
Customer, services and lending relationships ..... 12years $307 $(240) $67
Software and technology ................... 7years 93 (91) 2
Total intangible assets subject to amortization...... 400 (331) 69
Intangible assets not subject to amortization:
Trade names and trademarks ................ Indefinite 23 — 23
Total acquired intangible assets ................ $423 $(331) $92
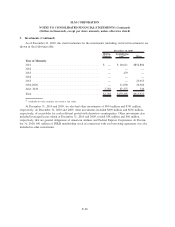
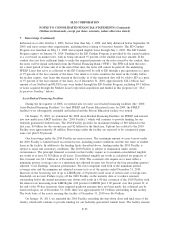
(Dollars in millions)
Average
Amortization
Period
Cost
Basis
(1)
Accumulated
Impairment and
Amortization
(1)
Net
As of December 31, 2009
Intangible assets subject to amortization:
Customer, services, and lending relationships . . . 12 years $332 $(208) $124
Software and technology .................. 7years 98 (89) 9
Total intangible assets subject to amortization ..... 430 (297) 133
Intangible assets not subject to amortization:
Trade names and trademarks ............... Indefinite 54 — 54
Total acquired intangible assets ............... $484 $(297) $187
(1)
Includes impairment amounts only if portion of the acquired intangible asset has been deemed impaired. When an acquired
intangible asset is considered fully impaired, the cost basis and any accumulated amortization related to the asset is written off.
F-46
SLM CORPORATION
NOTES TO CONSOLIDATED FINANCIAL STATEMENTS (Continued)
(Dollars in thousands, except per share amounts, unless otherwise stated)