Sallie Mae 2010 Annual Report Download - page 40
Download and view the complete annual report
Please find page 40 of the 2010 Sallie Mae annual report below. You can navigate through the pages in the report by either clicking on the pages listed below, or by using the keyword search tool below to find specific information within the annual report.-
 1
1 -
2
-
3
-
4
-
5
-
6
-
7
-
8
-
9
-
10
-
11
-
12
-
13
-
14
-
15
-
16
-
17
-
18
-
19
-
20
-
21
-
22
-
23
-
24
-
25
-
26
-
27
-
28
-
29
-
 30
30 -
 31
31 -
 32
32 -
 33
33 -
 34
34 -
 35
35 -
 36
36 -
 37
37 -
 38
38 -
 39
39 -
 40
40 -
 41
41 -
 42
42 -
 43
43 -
 44
44 -
 45
45 -
 46
46 -
 47
47 -
 48
48 -
 49
49 -
 50
50 -
51
-
52
-
53
-
54
-
55
-
56
-
57
-
58
-
59
-
60
-
61
-
62
-
63
-
64
-
65
-
66
-
67
-
68
-
69
-
70
-
71
-
72
-
73
-
74
-
75
-
76
-
77
-
78
-
79
-
80
-
81
-
82
-
83
-
84
-
85
-
86
-
87
-
88
-
89
-
90
-
91
-
92
-
93
-
94
-
95
-
96
-
97
-
98
-
99
-
100
-
101
-
102
-
103
-
104
-
105
-
106
-
107
-
108
-
109
-
110
-
111
-
112
-
113
-
114
-
115
-
116
-
117
-
118
-
119
-
120
-
121
-
122
-
123
-
124
-
125
-
126
-
127
-
128
-
129
-
130
-
131
-
132
-
133
-
134
-
135
-
136
-
137
-
138
-
139
-
140
-
141
-
142
-
143
-
144
-
145
-
146
-
147
-
148
-
149
-
150
-
151
-
152
-
153
-
154
-
155
-
156
-
157
-
158
-
159
-
160
-
161
-
162
-
163
-
164
-
165
-
166
-
167
-
168
-
169
-
170
-
171
-
172
-
173
-
174
-
175
-
176
-
177
-
178
-
179
-
180
-
181
-
182
-
183
-
184
-
185
-
186
-
187
-
188
-
189
-
190
-
191
-
192
-
193
-
194
-
195
-
196
-
197
-
198
-
199
-
200
-
201
-
202
-
203
-
204
-
205
-
206
-
207
-
208
-
209
-
210
-
211
-
212
-
213
-
214
-
215
-
216
-
217
-
218
-
219
-
220
-
221
-
222
-
223
-
224
-
225
-
226
 |
 |

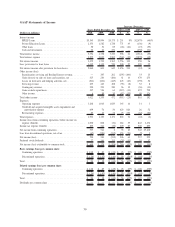
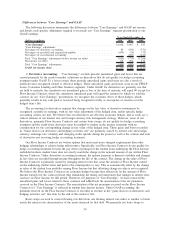
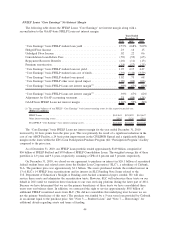
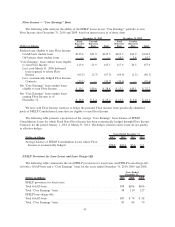
Differences between “Core Earnings” and GAAP
The following discussion summarizes the differences between “Core Earnings” and GAAP net income,
and details each specific adjustment required to reconcile our “Core Earnings” segment presentation to our
GAAP earnings.
(Dollars in millions) 2010 2009 2008
Years Ended December 31,
“Core Earnings”. . . . . . . . . . . . . . . . . . . . . . . . . . . . . . . . . . . . . . . . . . . . . . . $1,028 $ 807 $ 583
“Core Earnings” adjustments:
Net impact of derivative accounting . . . . . . . . . . . . . . . . . . . . . . . . . . . . . . . . . . 83 (502) (751)
Net impact of goodwill and acquired intangibles . . . . . . . . . . . . . . . . . . . . . . . . . (699) (76) (73)
Net impact of securitization accounting . . . . . . . . . . . . . . . . . . . . . . . . . . . . . . . — (201) (442)
Total “Core Earnings” adjustments before income tax effect . . . . . . . . . . . . . . . . . (616) (779) (1,266)
Net income tax effect . . . . . . . . . . . . . . . . . . . . . . . . . . . . . . . . . . . . . . . . . . . . 118 296 470
Total “Core Earnings” adjustments . . . . . . . . . . . . . . . . . . . . . . . . . . . . . . . . . . . (498) (483) (796)
GAAP net income (loss) . . . . . . . . . . . . . . . . . . . . . . . . . . . . . . . . . . . . . . . . . $ 530 $ 324 $ (213)
1) Derivative Accounting: “Core Earnings” exclude periodic unrealized gains and losses that are
caused primarily by the mark-to-market valuations on derivatives that do not qualify for hedge accounting
treatment under GAAP. To a lesser extent, these periodic unrealized gains and losses are also a result of
ineffectiveness recognized related to effective hedges. These unrealized gains and losses occur in our FFELP
Loans, Consumer Lending and Other business segments. Under GAAP, for derivatives we generally use that
are held to maturity, the cumulative net unrealized gain or loss at the time of maturity will equal $0 except for
Floor Income Contracts where the cumulative unrealized gain will equal the amount for which we sold the
contract. In our “Core Earnings” presentation, we recognize the economic effect of these hedges, which
generally results in any cash paid or received being recognized ratably as an expense or revenue over the
hedged item’s life.
The accounting for derivatives requires that changes in the fair value of derivative instruments be
recognized currently in earnings, with no fair value adjustment of the hedged item, unless specific hedge
accounting criteria are met. We believe that our derivatives are effective economic hedges, and as such, are a
critical element of our interest rate and foreign currency risk management strategy. However, some of our
derivatives, primarily Floor Income Contracts and certain basis swaps, do not qualify for hedge accounting
treatment and the stand-alone derivative must be marked-to-market in the income statement with no
consideration for the corresponding change in fair value of the hedged item. These gains and losses recorded
in “Gains (losses) on derivative and hedging activities, net” are primarily caused by interest rate and foreign
currency exchange rate volatility and changing credit spreads during the period as well as the volume and term
of derivatives not receiving hedge accounting treatment.
Our Floor Income Contracts are written options that must meet more stringent requirements than other
hedging relationships to achieve hedge effectiveness. Specifically, our Floor Income Contracts do not qualify for
hedge accounting treatment because the pay down of principal of the student loans underlying the Floor Income
embedded in those student loans does not exactly match the change in the notional amount of our written Floor
Income Contracts. Under derivatives accounting treatment, the upfront payment is deemed a liability and changes
in fair value are recorded through income throughout the life of the contract. The change in the value of Floor
Income Contracts is primarily caused by changing interest rates that cause the amount of Floor Income earned
on the underlying student loans and paid to the counterparties to vary. This is economically offset by the change
in value of the student loan portfolio earning Floor Income but that offsetting change in value is not recognized.
We believe the Floor Income Contracts are economic hedges because they effectively fix the amount of Floor
Income earned over the contract period, thus eliminating the timing and uncertainty that changes in interest rates
can have on Floor Income for that period. Therefore, for purposes of “Core Earnings”, we have removed the
unrealized gains and losses related to these contracts and added back the amortization of the net premiums
received on the Floor Income Contracts. The amortization of the net premiums received on the Floor Income
Contracts for “Core Earnings” is reflected in student loan interest income. Under GAAP accounting, the
premium received on the Floor Income Contracts is recorded as revenue in the “gains (losses) on derivatives and
hedging activities, net” line item by the end of the contracts’ life.
Basis swaps are used to convert floating rate debt from one floating interest rate index to another to better
match the interest rate characteristics of the assets financed by that debt. We primarily use basis swaps to
39