Sallie Mae 2010 Annual Report Download - page 142
Download and view the complete annual report
Please find page 142 of the 2010 Sallie Mae annual report below. You can navigate through the pages in the report by either clicking on the pages listed below, or by using the keyword search tool below to find specific information within the annual report.-
 1
1 -
2
-
3
-
4
-
5
-
6
-
7
-
8
-
9
-
10
-
11
-
12
-
13
-
14
-
15
-
16
-
17
-
18
-
19
-
20
-
21
-
22
-
23
-
24
-
25
-
26
-
27
-
28
-
29
-
30
-
31
-
32
-
33
-
34
-
35
-
36
-
37
-
38
-
39
-
40
-
41
-
42
-
43
-
44
-
45
-
46
-
47
-
48
-
49
-
50
-
51
-
52
-
53
-
54
-
55
-
56
-
57
-
58
-
59
-
60
-
61
-
62
-
63
-
64
-
65
-
66
-
67
-
68
-
69
-
70
-
71
-
72
-
73
-
74
-
75
-
76
-
77
-
78
-
79
-
80
-
81
-
82
-
83
-
84
-
85
-
86
-
87
-
88
-
89
-
90
-
91
-
92
-
93
-
94
-
95
-
96
-
97
-
98
-
99
-
100
-
101
-
102
-
103
-
104
-
105
-
106
-
107
-
108
-
109
-
110
-
111
-
112
-
113
-
114
-
115
-
116
-
117
-
118
-
119
-
120
-
121
-
122
-
123
-
124
-
125
-
126
-
127
-
128
-
129
-
130
-
131
-
 132
132 -
 133
133 -
 134
134 -
 135
135 -
 136
136 -
 137
137 -
 138
138 -
 139
139 -
 140
140 -
 141
141 -
 142
142 -
 143
143 -
 144
144 -
 145
145 -
 146
146 -
 147
147 -
 148
148 -
 149
149 -
 150
150 -
 151
151 -
 152
152 -
153
-
154
-
155
-
156
-
157
-
158
-
159
-
160
-
161
-
162
-
163
-
164
-
165
-
166
-
167
-
168
-
169
-
170
-
171
-
172
-
173
-
174
-
175
-
176
-
177
-
178
-
179
-
180
-
181
-
182
-
183
-
184
-
185
-
186
-
187
-
188
-
189
-
190
-
191
-
192
-
193
-
194
-
195
-
196
-
197
-
198
-
199
-
200
-
201
-
202
-
203
-
204
-
205
-
206
-
207
-
208
-
209
-
210
-
211
-
212
-
213
-
214
-
215
-
216
-
217
-
218
-
219
-
220
-
221
-
222
-
223
-
224
-
225
-
226
 |
 |

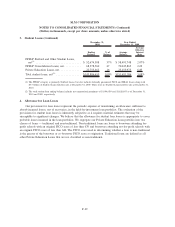
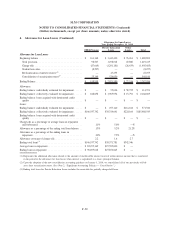
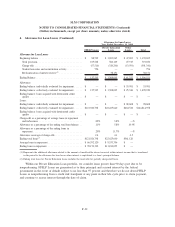
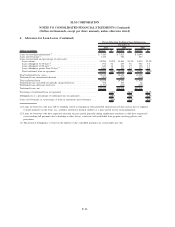
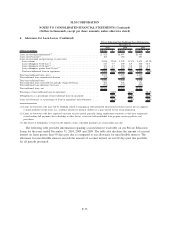
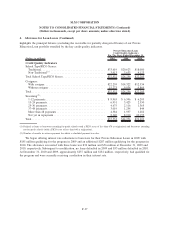
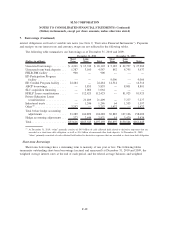
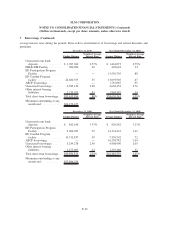
5. Investments (Continued)
Amortized
Cost
Gross
Unrealized
Gains
Gross
Unrealized
Losses
Fair
Value
December 31, 2009
Investments
Available-for-sale
U.S. Treasury securities and other U.S.
government agency obligations ......... $ 272 $ — $ — $ 272
Other securities:
Asset-backed securities............... 110,336 306 (893) 109,749
Commercial paper and asset-backed
commercial paper . . ............... 1,149,981 — — 1,149,981
Municipal bonds ................... 9,935 1,942 — 11,877
Other ............................ 1,550 — (154) 1,396
Total investment securities available-for-sale . . $1,272,074 $2,248 $(1,047) $1,273,275
Restricted Investments
Available-for sale
U.S. Treasury securities and other U.S.
government agency obligations ......... $ 25,026 $ — $ — $ 25,026
Guaranteed investment contracts.......... 26,951 — — 26,951
Total restricted investments
available-for-sale ................... $ 51,977 $ — $ — $ 51,977
Held-to-maturity
Guaranteed investment contracts.......... $ 3,550 $ — $ — $ 3,550
Other.............................. 215 — — 215
Total restricted investments held-to-maturity . . . $ 3,765 $ — $ — $ 3,765
As of December 31, 2010 and 2009, $2 million and $1 million of the net unrealized gain/(loss) (after tax)
related to available-for-sale investments was included in accumulated other comprehensive income. As of
December 31, 2010 and 2009, $36 million (all of which is in restricted cash and investments on the balance
sheet) and $50 million ($25 million of which is in restricted cash and investments on the balance sheet),
respectively, of available-for-sale investment securities were pledged as collateral.
There were no available-for-sale securities sold in 2010. We sold available-for-sale securities with a fair
value of $100 million and $457 million for the years ended December 31, 2009 and 2008, respectively. There
were no realized gains/(losses) for the years ended December 31, 2010 and 2009. There were $14 million in
realized gains (net of hedging losses totaling $4 million) for the year ended December 31, 2008. The cost
basis for these securities was determined through specific identification of the securities sold.
F-39
SLM CORPORATION
NOTES TO CONSOLIDATED FINANCIAL STATEMENTS (Continued)
(Dollars in thousands, except per share amounts, unless otherwise stated)