Sallie Mae 2010 Annual Report Download - page 43
Download and view the complete annual report
Please find page 43 of the 2010 Sallie Mae annual report below. You can navigate through the pages in the report by either clicking on the pages listed below, or by using the keyword search tool below to find specific information within the annual report.-
 1
1 -
2
-
3
-
4
-
5
-
6
-
7
-
8
-
9
-
10
-
11
-
12
-
13
-
14
-
15
-
16
-
17
-
18
-
19
-
20
-
21
-
22
-
23
-
24
-
25
-
26
-
27
-
28
-
29
-
30
-
31
-
32
-
 33
33 -
 34
34 -
 35
35 -
 36
36 -
 37
37 -
 38
38 -
 39
39 -
 40
40 -
 41
41 -
 42
42 -
 43
43 -
 44
44 -
 45
45 -
 46
46 -
 47
47 -
 48
48 -
 49
49 -
 50
50 -
 51
51 -
 52
52 -
 53
53 -
54
-
55
-
56
-
57
-
58
-
59
-
60
-
61
-
62
-
63
-
64
-
65
-
66
-
67
-
68
-
69
-
70
-
71
-
72
-
73
-
74
-
75
-
76
-
77
-
78
-
79
-
80
-
81
-
82
-
83
-
84
-
85
-
86
-
87
-
88
-
89
-
90
-
91
-
92
-
93
-
94
-
95
-
96
-
97
-
98
-
99
-
100
-
101
-
102
-
103
-
104
-
105
-
106
-
107
-
108
-
109
-
110
-
111
-
112
-
113
-
114
-
115
-
116
-
117
-
118
-
119
-
120
-
121
-
122
-
123
-
124
-
125
-
126
-
127
-
128
-
129
-
130
-
131
-
132
-
133
-
134
-
135
-
136
-
137
-
138
-
139
-
140
-
141
-
142
-
143
-
144
-
145
-
146
-
147
-
148
-
149
-
150
-
151
-
152
-
153
-
154
-
155
-
156
-
157
-
158
-
159
-
160
-
161
-
162
-
163
-
164
-
165
-
166
-
167
-
168
-
169
-
170
-
171
-
172
-
173
-
174
-
175
-
176
-
177
-
178
-
179
-
180
-
181
-
182
-
183
-
184
-
185
-
186
-
187
-
188
-
189
-
190
-
191
-
192
-
193
-
194
-
195
-
196
-
197
-
198
-
199
-
200
-
201
-
202
-
203
-
204
-
205
-
206
-
207
-
208
-
209
-
210
-
211
-
212
-
213
-
214
-
215
-
216
-
217
-
218
-
219
-
220
-
221
-
222
-
223
-
224
-
225
-
226
 |
 |

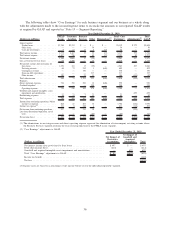
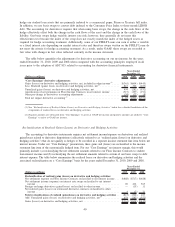
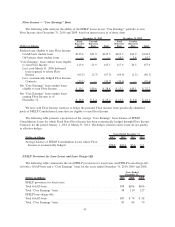
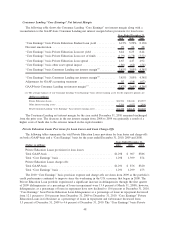
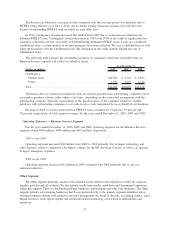
The following table summarizes “Core Earnings” securitization adjustments for the FFELP Loans and
Consumer Lending business segments for the years ended December 31, 2009 and 2008.
(Dollars in millions) 2009 2008
Years Ended
December 31,
“Core Earnings” securitization adjustments:
Net interest income on securitized loans, before provisions for loan losses and before
intercompany transactions . . . . . . . . . . . . . . . . . . . . . . . . . . . . . . . . . . . . . . . . . . . . . . . . $(942) $(872)
Provisions for loan losses . . . . . . . . . . . . . . . . . . . . . . . . . . . . . . . . . . . . . . . . . . . . . . . . . . 445 309
Net interest income on securitized loans, after provisions for loan losses, before intercompany
transactions . . . . . . . . . . . . . . . . . . . . . . . . . . . . . . . . . . . . . . . . . . . . . . . . . . . . . . . . . . (497) (563)
Intercompany transactions with off-balance sheet trusts . . . . . . . . . . . . . . . . . . . . . . . . . . . . . 1 (141)
Net interest income on securitized loans, after provisions for loan losses . . . . . . . . . . . . . . . . . (496) (704)
Securitization servicing and Residual Interest revenue . . . . . . . . . . . . . . . . . . . . . . . . . . . . . . 295 262
Total “Core Earnings” securitization adjustments
(1)
. . . . . . . . . . . . . . . . . . . . . . . . . . . . . . . . $(201) $(442)
(1) Negative amounts are subtracted from “Core Earnings” to arrive at GAAP net income and positive amounts are added to “Core
Earnings” to arrive at GAAP net income.
“Intercompany transactions with off-balance sheet trusts” in the above table relate primarily to losses that
result from the repurchase of delinquent loans from our off-balance sheet securitization trusts. When Private
Education Loans in our securitization trusts settling before September 30, 2005 became 180 days delinquent,
we previously exercised our contingent call option to repurchase these loans at par value out of the trust and
recorded a loss for the difference in the par value paid and the fair market value of the loan at the time of
purchase. We do not hold the contingent call option for any trusts settled after September 30, 2005. In October
2008, we decided to no longer exercise our contingent call option.
Business Segments
As a result of the change in segment reporting that occurred in the fourth quarter 2010, past periods have
been recast for comparison purposes. In connection with changing the reportable segments the following lists
other significant changes we made related to the new segment presentation:
• The operating expenses reported for each segment are directly attributable to the generation of revenues
by that segment. We have included corporate overhead and certain information technology costs
(together referred to as “Overhead”) in our Other segment rather than allocate those expenses by
segment.
• The creation of the FFELP Loans and Business Services segments has resulted in our accounting for
the significant servicing revenue we earn on FFELP Loans we own in the Business Services segment.
This bifurcates the FFELP interest income between the FFELP Loans and Business Services segment,
with an intercompany servicing fee charge from the Business Services segment. The intercompany
amounts are the contractual rates for encumbered loans within a financing facility or a similar market
rate if the loan is not in a financing facility and accordingly exceed our costs.
• In our GAAP-basis financial presentation we allocated existing goodwill to the new reporting units
within the reportable segments based upon relative fair value. During the fourth quarter 2010, we also
evaluated our goodwill for impairment using both the old reporting and new reporting unit framework
and there was no impairment under either analysis.
• Similar to prior periods, capital is assigned to each segment based on internally determined
risk-adjusted weightings for the assets in each segment. These weightings have been updated and differ
depending on the relative risk of each asset type and represent management’s view of the level of
capital needed to support different assets. Unsecured debt is allocated based on the remaining funding
needed for each segment after direct funding and the capital allocation has been considered.
42