Sallie Mae 2010 Annual Report Download - page 56
Download and view the complete annual report
Please find page 56 of the 2010 Sallie Mae annual report below. You can navigate through the pages in the report by either clicking on the pages listed below, or by using the keyword search tool below to find specific information within the annual report.-
 1
1 -
2
-
3
-
4
-
5
-
6
-
7
-
8
-
9
-
10
-
11
-
12
-
13
-
14
-
15
-
16
-
17
-
18
-
19
-
20
-
21
-
22
-
23
-
24
-
25
-
26
-
27
-
28
-
29
-
30
-
31
-
32
-
33
-
34
-
35
-
36
-
37
-
38
-
39
-
40
-
41
-
42
-
43
-
44
-
45
-
 46
46 -
 47
47 -
 48
48 -
 49
49 -
 50
50 -
 51
51 -
 52
52 -
 53
53 -
 54
54 -
 55
55 -
 56
56 -
 57
57 -
 58
58 -
 59
59 -
 60
60 -
 61
61 -
 62
62 -
 63
63 -
 64
64 -
 65
65 -
 66
66 -
67
-
68
-
69
-
70
-
71
-
72
-
73
-
74
-
75
-
76
-
77
-
78
-
79
-
80
-
81
-
82
-
83
-
84
-
85
-
86
-
87
-
88
-
89
-
90
-
91
-
92
-
93
-
94
-
95
-
96
-
97
-
98
-
99
-
100
-
101
-
102
-
103
-
104
-
105
-
106
-
107
-
108
-
109
-
110
-
111
-
112
-
113
-
114
-
115
-
116
-
117
-
118
-
119
-
120
-
121
-
122
-
123
-
124
-
125
-
126
-
127
-
128
-
129
-
130
-
131
-
132
-
133
-
134
-
135
-
136
-
137
-
138
-
139
-
140
-
141
-
142
-
143
-
144
-
145
-
146
-
147
-
148
-
149
-
150
-
151
-
152
-
153
-
154
-
155
-
156
-
157
-
158
-
159
-
160
-
161
-
162
-
163
-
164
-
165
-
166
-
167
-
168
-
169
-
170
-
171
-
172
-
173
-
174
-
175
-
176
-
177
-
178
-
179
-
180
-
181
-
182
-
183
-
184
-
185
-
186
-
187
-
188
-
189
-
190
-
191
-
192
-
193
-
194
-
195
-
196
-
197
-
198
-
199
-
200
-
201
-
202
-
203
-
204
-
205
-
206
-
207
-
208
-
209
-
210
-
211
-
212
-
213
-
214
-
215
-
216
-
217
-
218
-
219
-
220
-
221
-
222
-
223
-
224
-
225
-
226
 |
 |

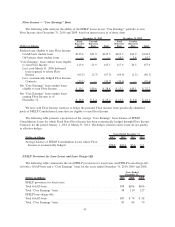
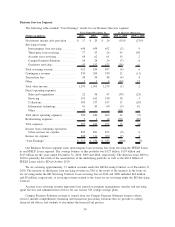
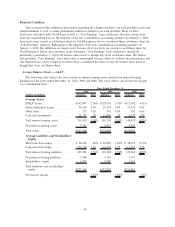
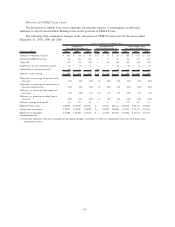
Rate/Volume Analysis — GAAP
The following rate/volume analysis shows the relative contribution of changes in interest rates and asset
volumes.
(Dollars in millions)
Increase
(Decrease) Rate Volume
Change Due To
(1)
2010 vs. 2009
Interest income ........................................ $ 996 $ 149 $847
Interest expense........................................ (760) (1,194) 434
Net interest income ..................................... $1,756 $ 1,416 $340
2009 vs. 2008
Interest income ........................................ $(2,512) $(3,252) $740
Interest expense........................................ (2,870) (3,435) 565
Net interest income ..................................... $ 358 $ 197 $161
(1) Changes in income and expense due to both rate and volume have been allocated in proportion to the relationship of the absolute
dollar amounts of the change in each. The changes in income and expense are calculated independently for each line in the table.
The totals for the rate and volume columns are not the sum of the individual lines.
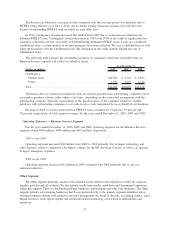
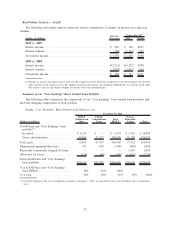
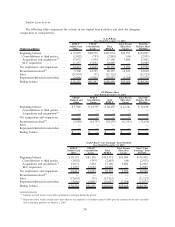
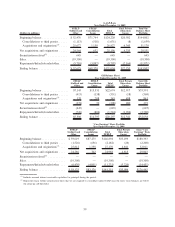
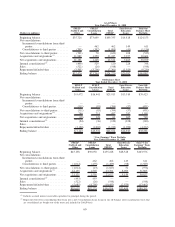
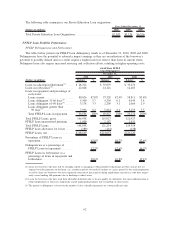
Summary of our “Core Earnings” Basis Student Loan Portfolio
The following tables summarize the components of our “Core Earnings” basis student loan portfolios and
show the changing composition of each portfolio.
Ending “Core Earnings” Basis Student Loan Balances, net
(Dollars in millions)
FFELP
Stafford and
Other
FFELP
Consolidation
Loans
Total
FFELP
Private
Education
Loans Total
December 31, 2010
GAAP-basis and “Core Earnings” basis
portfolio
(1)
:
In-school ......................... $ 6,333 $ — $ 6,333 $ 3,752 $ 10,085
Grace and repayment ................ 49,068 91,537 140,605 33,780 174,385
Total, gross ......................... 55,401 91,537 146,938 37,532 184,470
Unamortized premium/(discount) ......... 971 929 1,900 (894) 1,006
Receivable for partially charged-off loans . . . — — — 1,039 1,039
Allowance for losses .................. (120) (69) (189) (2,021) (2,210)
Total GAAP-basis and “Core Earnings”
basis portfolio ..................... $56,252 $92,397 $148,649 $35,656 $184,305
% of GAAP-basis and “Core Earnings”
basis FFELP ...................... 38% 62% 100%
% of total .......................... 31% 50% 81% 19% 100%
(1) Upon the adoption of the new consolidation accounting on January 1, 2010, we consolidated all of our off-balance sheet securitization
trusts.
55