Sallie Mae 2010 Annual Report Download - page 140
Download and view the complete annual report
Please find page 140 of the 2010 Sallie Mae annual report below. You can navigate through the pages in the report by either clicking on the pages listed below, or by using the keyword search tool below to find specific information within the annual report.-
 1
1 -
2
-
3
-
4
-
5
-
6
-
7
-
8
-
9
-
10
-
11
-
12
-
13
-
14
-
15
-
16
-
17
-
18
-
19
-
20
-
21
-
22
-
23
-
24
-
25
-
26
-
27
-
28
-
29
-
30
-
31
-
32
-
33
-
34
-
35
-
36
-
37
-
38
-
39
-
40
-
41
-
42
-
43
-
44
-
45
-
46
-
47
-
48
-
49
-
50
-
51
-
52
-
53
-
54
-
55
-
56
-
57
-
58
-
59
-
60
-
61
-
62
-
63
-
64
-
65
-
66
-
67
-
68
-
69
-
70
-
71
-
72
-
73
-
74
-
75
-
76
-
77
-
78
-
79
-
80
-
81
-
82
-
83
-
84
-
85
-
86
-
87
-
88
-
89
-
90
-
91
-
92
-
93
-
94
-
95
-
96
-
97
-
98
-
99
-
100
-
101
-
102
-
103
-
104
-
105
-
106
-
107
-
108
-
109
-
110
-
111
-
112
-
113
-
114
-
115
-
116
-
117
-
118
-
119
-
120
-
121
-
122
-
123
-
124
-
125
-
126
-
127
-
128
-
129
-
 130
130 -
 131
131 -
 132
132 -
 133
133 -
 134
134 -
 135
135 -
 136
136 -
 137
137 -
 138
138 -
 139
139 -
 140
140 -
 141
141 -
 142
142 -
 143
143 -
 144
144 -
 145
145 -
 146
146 -
 147
147 -
 148
148 -
 149
149 -
 150
150 -
151
-
152
-
153
-
154
-
155
-
156
-
157
-
158
-
159
-
160
-
161
-
162
-
163
-
164
-
165
-
166
-
167
-
168
-
169
-
170
-
171
-
172
-
173
-
174
-
175
-
176
-
177
-
178
-
179
-
180
-
181
-
182
-
183
-
184
-
185
-
186
-
187
-
188
-
189
-
190
-
191
-
192
-
193
-
194
-
195
-
196
-
197
-
198
-
199
-
200
-
201
-
202
-
203
-
204
-
205
-
206
-
207
-
208
-
209
-
210
-
211
-
212
-
213
-
214
-
215
-
216
-
217
-
218
-
219
-
220
-
221
-
222
-
223
-
224
-
225
-
226
 |
 |

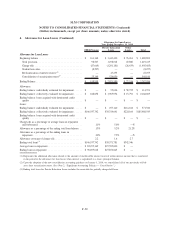
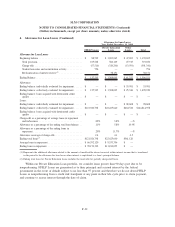
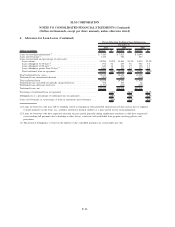
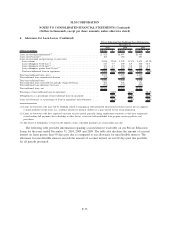
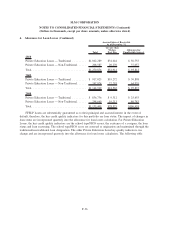
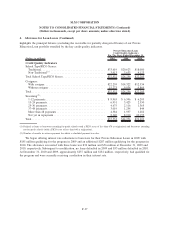
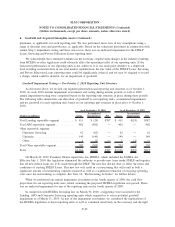
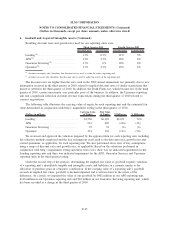
4. Allowance for Loan Losses (Continued)
highlights the principal balance (excluding the receivable for partially charged-off loans) of our Private
Education Loan portfolio stratified by the key credit quality indicators.
(Dollars in millions) 2010 2009 2008
Private Education Loans
Credit Quality Indicators
For The Years Ended December 31,
Credit Quality Indicators
School Type/FICO Scores:
Traditional......................................... $33,619 $20,623 $18,080
Non-Traditional
(1)
................................... 3,913 3,633 4,123
Total School Type/FICO Scores ........................... $37,532 $24,256 $22,203
Cosigners:
With cosigner . . .................................... $22,259 $14,322 $12,334
Without cosigner .................................... 15,273 9,934 9,869
Total ............................................... $37,532 $24,256 $22,203
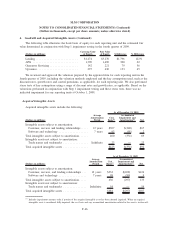
Seasoning
(2)
:
1-12 payments . . .................................... $ 9,963 $ 6,596 $ 6,203
13-24 payments . .................................... 6,951 3,423 2,350
25-36 payments . .................................... 4,675 2,116 1,365
37-48 payments . .................................... 3,019 1,254 844
More than 48 payments ............................... 4,584 1,957 1,282
Not yet in repayment ................................. 8,340 8,910 10,159
Total ............................................... $37,532 $24,256 $22,203
(1) Defined as loans to borrowers attending for-profit schools (with a FICO score of less than 670 at origination) and borrowers attending
not-for-profit schools (with a FICO score of less than 640 at origination).
(2) Number of months in active repayment for which a scheduled payment was due.
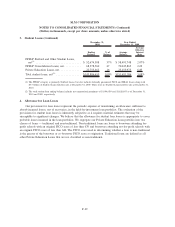
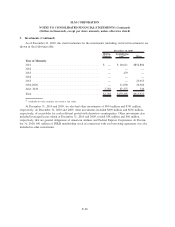
We began offering interest rate reductions to borrowers for their Private Education Loans in 2009 with
$185 million qualifying for the program in 2009 and an additional $287 million qualifying for the program in
2010. The allowance associated with these loans was $32 million and $56 million at December 31, 2009 and
2010, respectively. Subsequent to modification, no loans defaulted in 2009 and $53 million defaulted in 2010.
At December 31, 2010 and 2009, approximately $257 million and $181 million, respectively, had qualified for
the program and were currently receiving a reduction in their interest rate.
F-37
SLM CORPORATION
NOTES TO CONSOLIDATED FINANCIAL STATEMENTS (Continued)
(Dollars in thousands, except per share amounts, unless otherwise stated)