Sallie Mae 2010 Annual Report Download - page 51
Download and view the complete annual report
Please find page 51 of the 2010 Sallie Mae annual report below. You can navigate through the pages in the report by either clicking on the pages listed below, or by using the keyword search tool below to find specific information within the annual report.-
 1
1 -
2
-
3
-
4
-
5
-
6
-
7
-
8
-
9
-
10
-
11
-
12
-
13
-
14
-
15
-
16
-
17
-
18
-
19
-
20
-
21
-
22
-
23
-
24
-
25
-
26
-
27
-
28
-
29
-
30
-
31
-
32
-
33
-
34
-
35
-
36
-
37
-
38
-
39
-
40
-
 41
41 -
 42
42 -
 43
43 -
 44
44 -
 45
45 -
 46
46 -
 47
47 -
 48
48 -
 49
49 -
 50
50 -
 51
51 -
 52
52 -
 53
53 -
 54
54 -
 55
55 -
 56
56 -
 57
57 -
 58
58 -
 59
59 -
 60
60 -
 61
61 -
62
-
63
-
64
-
65
-
66
-
67
-
68
-
69
-
70
-
71
-
72
-
73
-
74
-
75
-
76
-
77
-
78
-
79
-
80
-
81
-
82
-
83
-
84
-
85
-
86
-
87
-
88
-
89
-
90
-
91
-
92
-
93
-
94
-
95
-
96
-
97
-
98
-
99
-
100
-
101
-
102
-
103
-
104
-
105
-
106
-
107
-
108
-
109
-
110
-
111
-
112
-
113
-
114
-
115
-
116
-
117
-
118
-
119
-
120
-
121
-
122
-
123
-
124
-
125
-
126
-
127
-
128
-
129
-
130
-
131
-
132
-
133
-
134
-
135
-
136
-
137
-
138
-
139
-
140
-
141
-
142
-
143
-
144
-
145
-
146
-
147
-
148
-
149
-
150
-
151
-
152
-
153
-
154
-
155
-
156
-
157
-
158
-
159
-
160
-
161
-
162
-
163
-
164
-
165
-
166
-
167
-
168
-
169
-
170
-
171
-
172
-
173
-
174
-
175
-
176
-
177
-
178
-
179
-
180
-
181
-
182
-
183
-
184
-
185
-
186
-
187
-
188
-
189
-
190
-
191
-
192
-
193
-
194
-
195
-
196
-
197
-
198
-
199
-
200
-
201
-
202
-
203
-
204
-
205
-
206
-
207
-
208
-
209
-
210
-
211
-
212
-
213
-
214
-
215
-
216
-
217
-
218
-
219
-
220
-
221
-
222
-
223
-
224
-
225
-
226
 |
 |

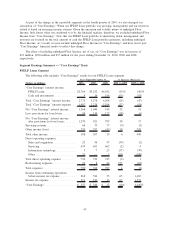
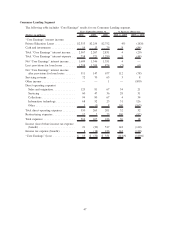
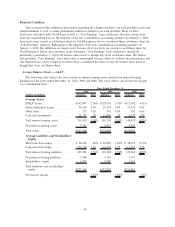
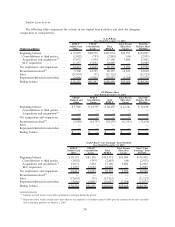
Business Services Segment
The following tables include “Core Earnings” results for our Business Services segment.
(Dollars in millions) 2010 2009 2008 2010 vs. 2009 2009 vs. 2008
Years Ended December 31, % Increase (Decrease)
Net interest income after provision ..... $ 17 $ 20 $ 26 (15)% (23)%
Servicing revenue:
Intercompany loan servicing . ....... 648 659 632 (2) 4
Third-party loan servicing . . . ....... 77 53 26 45 104
Account asset servicing ............ 68 62 61 10 2
Campus Payment Solutions . . ....... 26 28 26 (7) 8
Guarantor servicing............... 93 152 152 (39) —
Total servicing revenue .............. 912 954 897 (4) 6
Contingency revenue ............... 330 294 330 12 (11)
Transaction fees ................... 48 50 48 (4) 4
Other ........................... 3 5 4 (40) 25
Total other income ................. 1,293 1,303 1,279 (1) 2
Direct operating expenses:
Sales and originations ............. 22 36 47 (39) (23)
Servicing ...................... 191 162 158 18 3
Collections ..................... 183 157 197 17 (20)
Information technology ............ 81 85 60 (5) 42
Other ......................... 23 — — 100 —
Total direct operating expenses . ....... 500 440 462 14 (5)
Restructuring expenses .............. 7 2 10 250 (80)
Total expenses .................... 507 442 472 15 (6)
Income from continuing operations,
before income tax expense . . ....... 803 881 833 (9) 6
Income tax expense ................ 288 311 300 (7) 4
“Core Earnings” ................... $ 515 $ 570 $ 533 (10)% 7%
Our Business Services segment earns intercompany loan servicing fees from servicing the FFELP Loans
in our FFELP Loans segment. The average balance of this portfolio was $127 billion, $135 billion and
$125 billion for the years ended December 31, 2010, 2009 and 2008, respectively. The decrease from 2009 to
2010 is primarily the result of the amortization of the underlying portfolio as well as the $20.4 billion of
FFELP Loans sold to ED in October 2010.
We are servicing approximately 3.3 million accounts under the ED Servicing Contract as of December 31,
2010. The increase in third-party loan servicing revenue in 2010 is the result of the increase in the loans we
are servicing under the ED Servicing Contract. Loan servicing fees in 2010 and 2009 included $44 million
and $9 million, respectively, of servicing revenue related to the loans we are servicing under the ED Servicing
Contract.
Account asset servicing revenue represents fees earned on program management, transfer and servicing
agent services and administration services for our various 529 college-savings plans.
Campus Payment Solutions revenue is earned from our Campus Payment Solutions business whose
services include comprehensive financing and transaction processing solutions that we provide to college
financial aid offices and students to streamline the financial aid process.
50