Sallie Mae 2010 Annual Report Download - page 32
Download and view the complete annual report
Please find page 32 of the 2010 Sallie Mae annual report below. You can navigate through the pages in the report by either clicking on the pages listed below, or by using the keyword search tool below to find specific information within the annual report.-
 1
1 -
2
-
3
-
4
-
5
-
6
-
7
-
8
-
9
-
10
-
11
-
12
-
13
-
14
-
15
-
16
-
17
-
18
-
19
-
20
-
21
-
 22
22 -
 23
23 -
 24
24 -
 25
25 -
 26
26 -
 27
27 -
 28
28 -
 29
29 -
 30
30 -
 31
31 -
 32
32 -
 33
33 -
 34
34 -
 35
35 -
 36
36 -
 37
37 -
 38
38 -
 39
39 -
 40
40 -
 41
41 -
 42
42 -
43
-
44
-
45
-
46
-
47
-
48
-
49
-
50
-
51
-
52
-
53
-
54
-
55
-
56
-
57
-
58
-
59
-
60
-
61
-
62
-
63
-
64
-
65
-
66
-
67
-
68
-
69
-
70
-
71
-
72
-
73
-
74
-
75
-
76
-
77
-
78
-
79
-
80
-
81
-
82
-
83
-
84
-
85
-
86
-
87
-
88
-
89
-
90
-
91
-
92
-
93
-
94
-
95
-
96
-
97
-
98
-
99
-
100
-
101
-
102
-
103
-
104
-
105
-
106
-
107
-
108
-
109
-
110
-
111
-
112
-
113
-
114
-
115
-
116
-
117
-
118
-
119
-
120
-
121
-
122
-
123
-
124
-
125
-
126
-
127
-
128
-
129
-
130
-
131
-
132
-
133
-
134
-
135
-
136
-
137
-
138
-
139
-
140
-
141
-
142
-
143
-
144
-
145
-
146
-
147
-
148
-
149
-
150
-
151
-
152
-
153
-
154
-
155
-
156
-
157
-
158
-
159
-
160
-
161
-
162
-
163
-
164
-
165
-
166
-
167
-
168
-
169
-
170
-
171
-
172
-
173
-
174
-
175
-
176
-
177
-
178
-
179
-
180
-
181
-
182
-
183
-
184
-
185
-
186
-
187
-
188
-
189
-
190
-
191
-
192
-
193
-
194
-
195
-
196
-
197
-
198
-
199
-
200
-
201
-
202
-
203
-
204
-
205
-
206
-
207
-
208
-
209
-
210
-
211
-
212
-
213
-
214
-
215
-
216
-
217
-
218
-
219
-
220
-
221
-
222
-
223
-
224
-
225
-
226
 |
 |
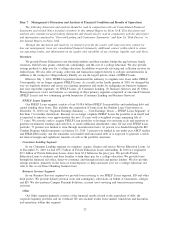
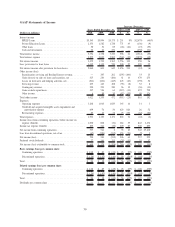
Consolidated Earnings Summary — GAAP-basis
Year Ended December 31, 2010 Compared with Year Ended December 31, 2009
For the years ended December 31, 2010 and 2009, net income was $530 million, or $.94 diluted earnings
per common share, and $324 million, or $.38 diluted earnings per common share, respectively. For the year
ended December 31, 2010 and 2009, net income from continuing operations was $597 million, or $1.08
diluted earnings per common share, and $544 million, or $.85 diluted earnings per common share, respectively.
For the year ended December 31, 2010 and 2009, net loss from discontinued operations was $67 million, or
$.14 diluted loss per common share, and $220 million, or $.47 diluted loss per common share from
discontinued operations per common share, respectively.
Income from Continuing Operations before Income Tax Expense
Income from continuing operations before income tax expenses increased for the year ended December 31,
2010, by $282 million as compared with the prior year primarily due to a $1.5 billion increase in net interest
income after provisions for loan losses and a $243 million decrease in net losses on derivative and hedging
activities. These improvements were partially offset by a $660 million goodwill and intangible asset
impairment charge, a $165 million increase in operating expenses, a $219 million decrease in gains on debt
repurchases and a decrease in securitization servicing and Residual Interest revenue of $295 million.
The primary contributors to each of the identified drivers of changes in income from continuing
operations before income tax expense for the year-over-year period are as follows:
• Net interest income after provisions for loan losses increased by $1.5 billion in the year ended
December 31, 2010 from the year ended December 31, 2009. The increase in net interest income and
provisions for loan losses was partially due to the adoption as of January 1, 2010 of the new
consolidation accounting guidance which resulted in the consolidation of $35.0 billion of assets and
$34.4 billion of liabilities in certain securitizations trusts. (See “Note 2 — Significant Accounting
Policies” for a further discussion of the effect of adopting the new consolidation accounting guidance).
The consolidation of these securitization trusts as of January 1, 2010 resulted in $998 million of
additional net interest income and $355 million of additional provisions for loan losses for the year
ended December 31, 2010. Excluding the effect of the trusts being consolidated as of January 1, 2010,
net interest income increased $758 million from the year ended 2009 and provisions for loan losses
decreased $55 million from the year ended 2009. The increase in net interest income, excluding the
effect of the new consolidation accounting guidance, was primarily the result of an increase in the
FFELP Loans net interest margin primarily due to an improvement in our funding costs, a 24 basis
point tightening of the CP/LIBOR spread and the effect of not receiving hedge accounting treatment for
derivatives used to economically hedge risk affecting net interest income. The decrease in the provisions
for loan losses relates to the Private Education Loan loss provision, which decreased as a result of the
improving performance of the portfolio.
• Securitization servicing and Residual Interest revenue was no longer recorded in fiscal year 2010 due to
the adoption of the new consolidation accounting guidance; however, we recognized $295 million in
the prior year.
• Gains on sales of loans and securities increased $41 million from the prior year primarily related to the
gains on sales of additional FFELP Loans to ED as part of ED’s Loan Purchase Commitment Program
(the “Purchase Program”). These gains will not occur in the future as the Purchase Program ended in
2010.
• Losses on derivatives and hedging activities, net, declined by $243 million in 2010 compared with
2009. The primary factor affecting the change in losses in 2010 was interest rates. Valuations of
derivative instruments vary based upon many factors including changes in interest rates, credit risk,
foreign currency fluctuations and other market factors. As a result, we expect gains and (losses) on
derivatives and hedging activities, net, to vary significantly in future periods.
31