Sallie Mae 2010 Annual Report Download - page 44
Download and view the complete annual report
Please find page 44 of the 2010 Sallie Mae annual report below. You can navigate through the pages in the report by either clicking on the pages listed below, or by using the keyword search tool below to find specific information within the annual report.-
 1
1 -
2
-
3
-
4
-
5
-
6
-
7
-
8
-
9
-
10
-
11
-
12
-
13
-
14
-
15
-
16
-
17
-
18
-
19
-
20
-
21
-
22
-
23
-
24
-
25
-
26
-
27
-
28
-
29
-
30
-
31
-
32
-
33
-
 34
34 -
 35
35 -
 36
36 -
 37
37 -
 38
38 -
 39
39 -
 40
40 -
 41
41 -
 42
42 -
 43
43 -
 44
44 -
 45
45 -
 46
46 -
 47
47 -
 48
48 -
 49
49 -
 50
50 -
 51
51 -
 52
52 -
 53
53 -
 54
54 -
55
-
56
-
57
-
58
-
59
-
60
-
61
-
62
-
63
-
64
-
65
-
66
-
67
-
68
-
69
-
70
-
71
-
72
-
73
-
74
-
75
-
76
-
77
-
78
-
79
-
80
-
81
-
82
-
83
-
84
-
85
-
86
-
87
-
88
-
89
-
90
-
91
-
92
-
93
-
94
-
95
-
96
-
97
-
98
-
99
-
100
-
101
-
102
-
103
-
104
-
105
-
106
-
107
-
108
-
109
-
110
-
111
-
112
-
113
-
114
-
115
-
116
-
117
-
118
-
119
-
120
-
121
-
122
-
123
-
124
-
125
-
126
-
127
-
128
-
129
-
130
-
131
-
132
-
133
-
134
-
135
-
136
-
137
-
138
-
139
-
140
-
141
-
142
-
143
-
144
-
145
-
146
-
147
-
148
-
149
-
150
-
151
-
152
-
153
-
154
-
155
-
156
-
157
-
158
-
159
-
160
-
161
-
162
-
163
-
164
-
165
-
166
-
167
-
168
-
169
-
170
-
171
-
172
-
173
-
174
-
175
-
176
-
177
-
178
-
179
-
180
-
181
-
182
-
183
-
184
-
185
-
186
-
187
-
188
-
189
-
190
-
191
-
192
-
193
-
194
-
195
-
196
-
197
-
198
-
199
-
200
-
201
-
202
-
203
-
204
-
205
-
206
-
207
-
208
-
209
-
210
-
211
-
212
-
213
-
214
-
215
-
216
-
217
-
218
-
219
-
220
-
221
-
222
-
223
-
224
-
225
-
226
 |
 |

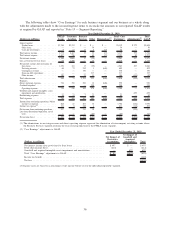
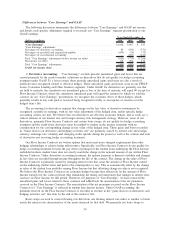
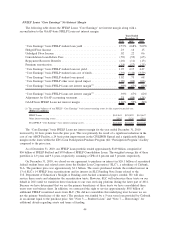
As part of the change in the reportable segments in the fourth quarter of 2010, we also changed our
calculation of “Core Earnings.” When our FFELP Loan portfolio was growing, management and our investors
valued it based on recurring income streams. Given the uncertain and volatile nature of unhedged Floor
Income, little future value was attributed to it by the financial markets; therefore, we excluded unhedged Floor
Income from “Core Earnings.” Now that our FFELP Loan portfolio is amortizing down, management and
investors are focused on the total amount of cash the FFELP Loan portfolio generates, including unhedged
Floor Income. As a result, we now include unhedged Floor Income in “Core Earnings” and have recast past
“Core Earnings” financial results to reflect this change.
The effect of including unhedged Floor Income, net of tax, on “Core Earnings” was an increase of
$21 million, $210 million and $57 million for the years ending December 31, 2010, 2009 and 2008,
respectively.
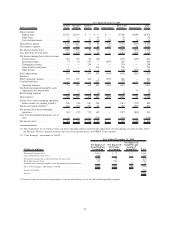
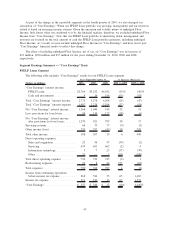
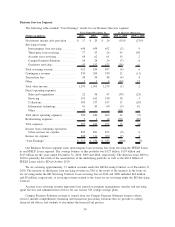
Segment Earnings Summary — “Core Earnings” Basis
FFELP Loans Segment
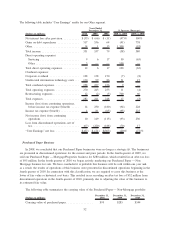
The following table includes “Core Earnings” results for our FFELP Loans segment.
(Dollars in millions) 2010 2009 2008 2010 vs. 2009 2009 vs. 2008
Years Ended December 31, % Increase (Decrease)
“Core Earnings” interest income:
FFELP Loans ................... $2,766 $3,252 $6,052 (15)% (46)%
Cash and investments ............. 9 26 156 (65) (83)
Total “Core Earnings” interest income . . . 2,775 3,278 6,208 (15) (47)
Total “Core Earnings” interest expense . . 1,407 2,238 5,294 (37) (58)
Net “Core Earnings” interest income .... 1,368 1,040 914 32 14
Less: provisions for loan losses . ....... 98 119 127 (18) (6)
Net “Core Earnings” interest income
after provisions for loan losses ...... 1,270 921 787 38 17
Servicing revenue .................. 68 75 77 (9) (3)
Other income (loss) ................ 320 292 (42) 10 795
Total other income ................. 388 367 35 6 949
Direct operating expenses:
Sales and origination.............. 23 56 57 (59) (2)
Servicing ...................... 679 691 662 (2) 4
Information technology ............ 3 7 23 (57) (70)
Other ......................... 31 — 3 100 (100)
Total direct operating expense . . ....... 736 754 745 (2) 1
Restructuring expenses .............. 54 8 42 575 (81)
Total expenses .................... 790 762 787 4 (3)
Income from continuing operations,
before income tax expense . . ....... 868 526 35 65 1,403
Income tax expense ................ 311 186 13 67 1,331
“Core Earnings” ................... $ 557 $ 340 $ 22 64% 1,445%
43