Sallie Mae 2010 Annual Report Download - page 145
Download and view the complete annual report
Please find page 145 of the 2010 Sallie Mae annual report below. You can navigate through the pages in the report by either clicking on the pages listed below, or by using the keyword search tool below to find specific information within the annual report.-
 1
1 -
2
-
3
-
4
-
5
-
6
-
7
-
8
-
9
-
10
-
11
-
12
-
13
-
14
-
15
-
16
-
17
-
18
-
19
-
20
-
21
-
22
-
23
-
24
-
25
-
26
-
27
-
28
-
29
-
30
-
31
-
32
-
33
-
34
-
35
-
36
-
37
-
38
-
39
-
40
-
41
-
42
-
43
-
44
-
45
-
46
-
47
-
48
-
49
-
50
-
51
-
52
-
53
-
54
-
55
-
56
-
57
-
58
-
59
-
60
-
61
-
62
-
63
-
64
-
65
-
66
-
67
-
68
-
69
-
70
-
71
-
72
-
73
-
74
-
75
-
76
-
77
-
78
-
79
-
80
-
81
-
82
-
83
-
84
-
85
-
86
-
87
-
88
-
89
-
90
-
91
-
92
-
93
-
94
-
95
-
96
-
97
-
98
-
99
-
100
-
101
-
102
-
103
-
104
-
105
-
106
-
107
-
108
-
109
-
110
-
111
-
112
-
113
-
114
-
115
-
116
-
117
-
118
-
119
-
120
-
121
-
122
-
123
-
124
-
125
-
126
-
127
-
128
-
129
-
130
-
131
-
132
-
133
-
134
-
 135
135 -
 136
136 -
 137
137 -
 138
138 -
 139
139 -
 140
140 -
 141
141 -
 142
142 -
 143
143 -
 144
144 -
 145
145 -
 146
146 -
 147
147 -
 148
148 -
 149
149 -
 150
150 -
 151
151 -
 152
152 -
 153
153 -
 154
154 -
 155
155 -
156
-
157
-
158
-
159
-
160
-
161
-
162
-
163
-
164
-
165
-
166
-
167
-
168
-
169
-
170
-
171
-
172
-
173
-
174
-
175
-
176
-
177
-
178
-
179
-
180
-
181
-
182
-
183
-
184
-
185
-
186
-
187
-
188
-
189
-
190
-
191
-
192
-
193
-
194
-
195
-
196
-
197
-
198
-
199
-
200
-
201
-
202
-
203
-
204
-
205
-
206
-
207
-
208
-
209
-
210
-
211
-
212
-
213
-
214
-
215
-
216
-
217
-
218
-
219
-
220
-
221
-
222
-
223
-
224
-
225
-
226
 |
 |

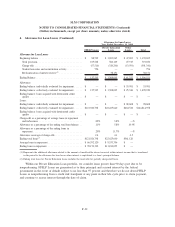
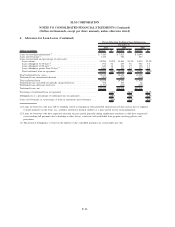
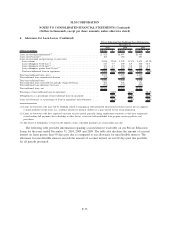
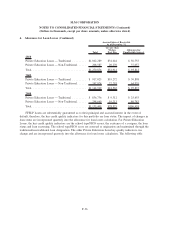
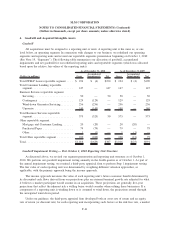
6. Goodwill and Acquired Intangible Assets (Continued)
rate of return, a measure of volatility (Beta) and a company specific and capital markets risk premium, as
appropriate, to adjust for volatility and uncertainty in the economy and to capture specific risk related to the
respective reporting units. We considered whether an asset sale or an equity sale would be the most likely sale
structure for each reporting unit and valued each reporting unit based on the more likely hypothetical scenario.
Resulting discount rates and growth rates used for the FFELP Loans, Servicing, and Private Education Loans
reporting units were:
Discount Rate Growth Rate
Fourth Quarter 2010
FFELP Loans
(1)
.......................................... 10% 0%
Servicing
(2)
............................................. 14% 2.5%
Private Education Loans
(1)
.................................. 19% 0.5%
(1)
Assumes an equity sale; therefore, the discount rate is used to value the entire reporting unit.
(2)
Assumes an asset sale; therefore, the discount rate is used to value the assets of the reporting unit.
The discount rates reflect market based estimates of capital costs and are adjusted for our assessment of a
market participant’s view with respect to execution, concentration and other risks associated with the projected
cash flows of individual reporting units. We reviewed and approved the discount rates provided by the third-
party appraiser including the factors incorporated to develop the discount rates for each reporting unit. For the
valuations assuming an equity sale, the discount rate was applied to the reporting unit’s projected net cash
flows and the residual or terminal value yielding the fair value of equity for the reporting unit. For valuations
assuming an asset sale, the discount rates applicable to the individual reporting units were applied to the
respective reporting units’ projected asset cash flows and residual or terminal values, as applicable, yielding
the fair value of the assets for the respective reporting units. The estimated proceeds from the hypothetical
asset sale were then used to payoff any liabilities of the reporting unit with the remaining cash equaling the
fair value of the reporting unit’s equity.
The guideline company or market approach was also considered for our FFELP Loans and Private
Education Loans reporting units. The market approach generally measures the value of a reporting unit as
compared to recent sales or offerings of comparable companies. The secondary market approach indicates
value based on multiples calculated using the market value of minority interests in publicly traded comparable
companies or guideline companies. Whether analyzing comparable transactions or the market value of
minority interests in publicly traded guideline companies, consideration is given to the line of business and the
operating performance of the comparable companies versus the reporting unit being tested.
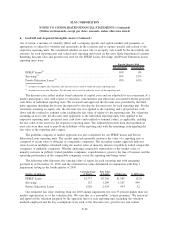
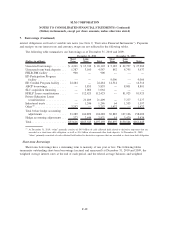
The following table illustrates the carrying value of equity for each reporting unit with remaining
goodwill as of December 31, 2010, and the estimated fair value determined in conjunction with Step 1
impairment testing in the fourth quarter of 2010.
(Dollars in millions)
Carrying Value
of Equity
Fair Value
of Equity $ Difference % Difference
FFELP Loans ....................... $1,777 $3,766 $1,989 112%
Servicing .......................... 123 1,290 1,167 949
Private Education Loans ............... 1,920 2,914 994 52
Our estimated fair value resulting from our 2010 annual impairment test was 53 percent higher than our
market capitalization as of the valuation date. We view this as a reasonable “control premium.” We reviewed
and approved the valuation prepared by the appraisal firm for each reporting unit, including the valuation
methods employed and the key assumptions used, such as the discount rates, growth rates and control
F-42
SLM CORPORATION
NOTES TO CONSOLIDATED FINANCIAL STATEMENTS (Continued)
(Dollars in thousands, except per share amounts, unless otherwise stated)