Sallie Mae 2010 Annual Report Download - page 35
Download and view the complete annual report
Please find page 35 of the 2010 Sallie Mae annual report below. You can navigate through the pages in the report by either clicking on the pages listed below, or by using the keyword search tool below to find specific information within the annual report.-
 1
1 -
2
-
3
-
4
-
5
-
6
-
7
-
8
-
9
-
10
-
11
-
12
-
13
-
14
-
15
-
16
-
17
-
18
-
19
-
20
-
21
-
22
-
23
-
24
-
 25
25 -
 26
26 -
 27
27 -
 28
28 -
 29
29 -
 30
30 -
 31
31 -
 32
32 -
 33
33 -
 34
34 -
 35
35 -
 36
36 -
 37
37 -
 38
38 -
 39
39 -
 40
40 -
 41
41 -
 42
42 -
 43
43 -
 44
44 -
 45
45 -
46
-
47
-
48
-
49
-
50
-
51
-
52
-
53
-
54
-
55
-
56
-
57
-
58
-
59
-
60
-
61
-
62
-
63
-
64
-
65
-
66
-
67
-
68
-
69
-
70
-
71
-
72
-
73
-
74
-
75
-
76
-
77
-
78
-
79
-
80
-
81
-
82
-
83
-
84
-
85
-
86
-
87
-
88
-
89
-
90
-
91
-
92
-
93
-
94
-
95
-
96
-
97
-
98
-
99
-
100
-
101
-
102
-
103
-
104
-
105
-
106
-
107
-
108
-
109
-
110
-
111
-
112
-
113
-
114
-
115
-
116
-
117
-
118
-
119
-
120
-
121
-
122
-
123
-
124
-
125
-
126
-
127
-
128
-
129
-
130
-
131
-
132
-
133
-
134
-
135
-
136
-
137
-
138
-
139
-
140
-
141
-
142
-
143
-
144
-
145
-
146
-
147
-
148
-
149
-
150
-
151
-
152
-
153
-
154
-
155
-
156
-
157
-
158
-
159
-
160
-
161
-
162
-
163
-
164
-
165
-
166
-
167
-
168
-
169
-
170
-
171
-
172
-
173
-
174
-
175
-
176
-
177
-
178
-
179
-
180
-
181
-
182
-
183
-
184
-
185
-
186
-
187
-
188
-
189
-
190
-
191
-
192
-
193
-
194
-
195
-
196
-
197
-
198
-
199
-
200
-
201
-
202
-
203
-
204
-
205
-
206
-
207
-
208
-
209
-
210
-
211
-
212
-
213
-
214
-
215
-
216
-
217
-
218
-
219
-
220
-
221
-
222
-
223
-
224
-
225
-
226
 |
 |
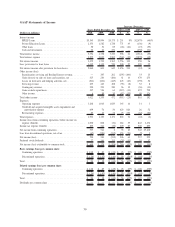
• Gains on sales of loans and securities increased $470 million from the prior year. The increase is
primarily attributable to a $284 million gain on our sale of approximately $18.5 billion of FFELP
Loans to ED as part of the ED Purchase Program and the $186 million loss incurred in fiscal year
2008. The 2008 loss resulted from our repurchase of delinquent Private Education Loans from our off-
balance sheet securitization trusts and the sale of approximately $1.0 billion FFELP Loans to the ED
under ECASLA, which resulted in a $53 million loss.
• Losses on derivatives and hedging activities, net, increased by $159 million in 2009 compared with
2008. The primary factors affecting the change in losses in 2009 were interest rates and foreign
currency exchange rates. Valuations of derivative instruments vary based upon many factors, including
changes in interest rates, credit risk, foreign currency fluctuations and other market factors. As a result,
we expect gains and (losses) on derivatives and hedging activities, net, to vary significantly in future
periods.
• Servicing Revenue increased $32 million when compared with the prior year. This increase was
primarily due to the initiation of Direct Lending servicing in 2009.
• Contingency revenue decreased $36 million when compared with the prior year primarily as a result of
less Guarantor collections revenue from rehabilitating delinquent FFELP Loans.
• Gains on debt repurchases increased $472 million when compared with the prior year. We repurchased
$3.4 billion of our unsecured corporate debt as compared with $1.9 billion in the prior year.
• Other income increased by $49 million primarily due to a $54 million increase in foreign currency
translation gains. These gains were partially offset by the “losses on derivative and hedging activities,
net” line item on the income statement related to the derivatives used to economically hedge these debt
instruments.
• For the years ended December 31, 2009 and 2008, operating expenses, excluding restructuring-related
asset impairments of $0 and $6 million, respectively, were $1,043 million compared with $1,023 million,
respectively. The $20 million increase from the prior year relates to increased marketing expense related
to our direct to consumer marketing activities, increased technology costs as well as increased
collections costs.
• Goodwill and intangible asset impairment for continuing operations increased by $35 million in 2009
and the goodwill and intangible asset impairment for discontinued operations decreased by like amount
as compared with the prior year. For additional discussion regarding the impairment of goodwill and
intangible assets see “Note 6 — Goodwill and Acquired Intangible Assets.” The amortization of
acquired intangibles for continuing operations totaled $38 million and $48 million for the years ended
December 31, 2009 and 2008, respectively, and the amortization of acquired intangibles for discontin-
ued operations totaled $1 million and $6 million for the years ended December 31, 2009 and 2008,
respectively.
• Restructuring expenses of $22 million and $84 million were recognized in the years ended December 31,
2009 and 2008, respectively, of which $10 million and $72 million were in continuing operations and
$12 million and $12 million were in discontinued operations, respectively.
• Income tax expense from continuing operations was $264 million in 2009 compared with an income
tax benefit of $36 million in 2008, resulting in effective tax rates of 33 percent and 106 percent,
respectively. The movement in the effective tax rate in 2009 compared with the prior year was primarily
driven by the reduction of tax and interest on U.S. federal and state uncertain tax positions in both
periods, as well as the permanent tax impact of deducting Proposed Merger-related transaction costs in
2008. Also contributing to the higher effective tax rate in 2008 was the effect of significantly higher
reported pre-tax income in 2009 and the resulting changes in the proportion of income subject to
federal and state taxes. For additional information, see “Note 18 — Income Taxes.”
34