Sallie Mae 2010 Annual Report Download - page 171
Download and view the complete annual report
Please find page 171 of the 2010 Sallie Mae annual report below. You can navigate through the pages in the report by either clicking on the pages listed below, or by using the keyword search tool below to find specific information within the annual report.-
 1
1 -
2
-
3
-
4
-
5
-
6
-
7
-
8
-
9
-
10
-
11
-
12
-
13
-
14
-
15
-
16
-
17
-
18
-
19
-
20
-
21
-
22
-
23
-
24
-
25
-
26
-
27
-
28
-
29
-
30
-
31
-
32
-
33
-
34
-
35
-
36
-
37
-
38
-
39
-
40
-
41
-
42
-
43
-
44
-
45
-
46
-
47
-
48
-
49
-
50
-
51
-
52
-
53
-
54
-
55
-
56
-
57
-
58
-
59
-
60
-
61
-
62
-
63
-
64
-
65
-
66
-
67
-
68
-
69
-
70
-
71
-
72
-
73
-
74
-
75
-
76
-
77
-
78
-
79
-
80
-
81
-
82
-
83
-
84
-
85
-
86
-
87
-
88
-
89
-
90
-
91
-
92
-
93
-
94
-
95
-
96
-
97
-
98
-
99
-
100
-
101
-
102
-
103
-
104
-
105
-
106
-
107
-
108
-
109
-
110
-
111
-
112
-
113
-
114
-
115
-
116
-
117
-
118
-
119
-
120
-
121
-
122
-
123
-
124
-
125
-
126
-
127
-
128
-
129
-
130
-
131
-
132
-
133
-
134
-
135
-
136
-
137
-
138
-
139
-
140
-
141
-
142
-
143
-
144
-
145
-
146
-
147
-
148
-
149
-
150
-
151
-
152
-
153
-
154
-
155
-
156
-
157
-
158
-
159
-
160
-
 161
161 -
 162
162 -
 163
163 -
 164
164 -
 165
165 -
 166
166 -
 167
167 -
 168
168 -
 169
169 -
 170
170 -
 171
171 -
 172
172 -
 173
173 -
 174
174 -
 175
175 -
 176
176 -
 177
177 -
 178
178 -
 179
179 -
 180
180 -
 181
181 -
182
-
183
-
184
-
185
-
186
-
187
-
188
-
189
-
190
-
191
-
192
-
193
-
194
-
195
-
196
-
197
-
198
-
199
-
200
-
201
-
202
-
203
-
204
-
205
-
206
-
207
-
208
-
209
-
210
-
211
-
212
-
213
-
214
-
215
-
216
-
217
-
218
-
219
-
220
-
221
-
222
-
223
-
224
-
225
-
226
 |
 |

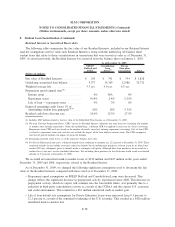
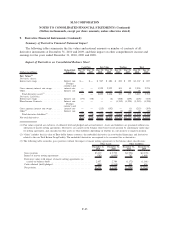
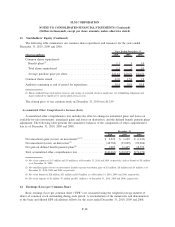
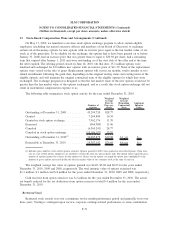
11. Stockholders’ Equity (Continued)
The following table summarizes our common share repurchases and issuances for the years ended
December 31, 2010, 2009 and 2008.
(Shares in millions) 2010 2009 2008
Years Ended December 31,
Common shares repurchased:
Benefit plans
(1)
........................................ 1.1 .3 1.0
Total shares repurchased ................................. 1.1 .3 1.0
Average purchase price per share ........................... $13.44 $20.29 $24.51
Common shares issued .................................... 43.0 17.8 1.9
Authority remaining at end of period for repurchases .............. 38.8 38.8 38.8
(1) Shares withheld from stock option exercises and vesting of restricted stock for employees’ tax withholding obligations and
shares tendered by employees to satisfy option exercise costs.
The closing price of our common stock on December 31, 2010 was $12.59.
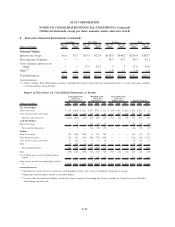
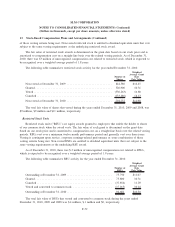
Accumulated Other Comprehensive Income (Loss)
Accumulated other comprehensive loss includes the after-tax change in unrealized gains and losses on
available-for-sale investments, unrealized gains and losses on derivatives, and the defined benefit pension plans
adjustment. The following table presents the cumulative balances of the components of other comprehensive
loss as of December 31, 2010, 2009 and 2008.
2010 2009 2008
December 31,
Net unrealized gains (losses) on investments
(1)(2)
............ $ 2,222 $ 1,629 $ (1,243)
Net unrealized (losses) on derivatives
(3)
................... (48,789) (53,899) (93,986)
Net gain on defined benefit pension plans
(4)
................ 1,903 11,445 18,753
Total accumulated other comprehensive loss ................ $(44,664) $(40,825) $(76,476)
(1) Net of tax expense of $1.3 million and $.9 million as of December 31, 2010 and 2009, respectively, and tax benefit of $.8 million
as of December 31, 2008.
(2) Net unrealized gains (losses) on investments include currency translation gains of $.5 million, $.8 million and $.4 million as of
December 31, 2010, 2009 and 2008, respectively.
(3) Net of tax benefit of $28 million, $31 million and $53 million as of December 31, 2010, 2009 and 2008, respectively.
(4) Net of tax expense of $1 million, $7 million and $11 million as of December 31, 2010, 2009 and 2008, respectively.
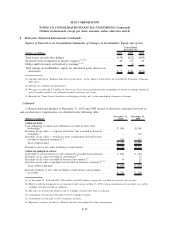
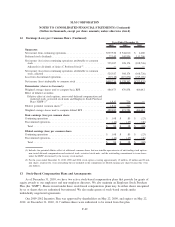
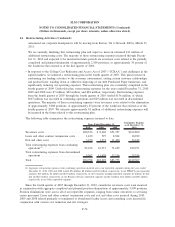
12. Earnings (Loss) per Common Share
Basic earnings (loss) per common share (“EPS”) are calculated using the weighted average number of
shares of common stock outstanding during each period. A reconciliation of the numerators and denominators
of the basic and diluted EPS calculations follows for the years ended December 31, 2010, 2009 and 2008.
F-68
SLM CORPORATION
NOTES TO CONSOLIDATED FINANCIAL STATEMENTS (Continued)
(Dollars in thousands, except per share amounts, unless otherwise stated)