Sallie Mae 2010 Annual Report Download - page 81
Download and view the complete annual report
Please find page 81 of the 2010 Sallie Mae annual report below. You can navigate through the pages in the report by either clicking on the pages listed below, or by using the keyword search tool below to find specific information within the annual report.
We have liquidity exposure related to collateral movements between us and our derivative counterparties.
Movements in the value of the derivatives, which are primarily affected by changes in interest rate and foreign
exchange rates, may require us to return cash collateral held or may require us to access primary liquidity to
post collateral to counterparties. If our credit ratings are downgraded from current levels, we may be required
to segregate unrestricted cash collateral into restricted accounts.
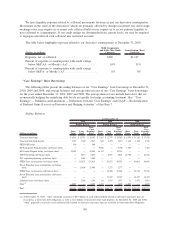
The table below highlights exposure related to our derivative counterparties at December 31, 2010.
(Dollars in millions)
SLM Corporation
and Sallie Mae Bank
Contracts
Securitization Trust
Contracts
Exposure, net of collateral .......................... $296 $1,167
Percent of exposure to counterparties with credit ratings
below S&P AA- or Moody’s Aa3 ................... 65% 31%
Percent of exposure to counterparties with credit ratings
below S&P A- or Moody’s A3 . . ................... 0% 0%
“Core Earnings” Basis Borrowings
The following tables present the ending balances of our “Core Earnings” basis borrowings at December 31,
2010, 2009 and 2008, and average balances and average interest rates of our “Core Earnings” basis borrowings
for the years ended December 31, 2010, 2009 and 2008. The average interest rates include derivatives that are
economically hedging the underlying debt but do not qualify for hedge accounting treatment. (See “‘Core
Earnings’ — Definition and Limitations — Differences between ‘Core Earnings’ and GAAP — Reclassification
of Realized Gains (Losses) on Derivative and Hedging Activities” of this Item 7.
Ending Balances
(Dollars in millions)
Short
Term
Long
Term
Total
“Core
Earnings”
Basis
Short
Term
Long
Term
Total
“Core
Earnings”
Basis
Short
Term
Long
Term
Total
“Core
Earnings”
Basis
Ending Balance Ending Balance Ending Balance
2010 2009 2008
As of December 31,
Unsecured borrowings . . .................... $4,361 $ 15,742 $ 20,103 $ 5,185 $ 22,797 $ 27,982 $ 6,794 $ 31,182 $ 37,976
Unsecured term bank deposits . . . ............... 1,387 3,160 4,547 842 4,795 5,637 1,148 1,108 2,256
FHLB-DM facility ........................ 900 — 900 — — — — — —
ED Participation Program facility (on-balance sheet) . . . . — — — 9,006 — 9,006 7,365 — 7,365
ED Conduit Program facility (on-balance sheet) . . ..... 24,484 — 24,484 14,314 — 14,314 — — —
ABCP borrowings (on-balance sheet) . . . .......... — 5,853 5,853 — 8,801 8,801 24,768 — 24,768
SLC acquisition financing (on-balance sheet) ......... — 1,064 1,064 — — — — — —
FFELP Loan securitizations (on-balance sheet). . . ..... — 112,425 112,425 — 81,923 81,923 — 80,601 80,601
Private Education Loan securitizations (on-balance
sheet) . . ............................. — 21,409 21,409 — 7,277 7,277 — — —
FFELP Loan securitizations (off-balance sheet) . . ..... — — — — 20,268 20,268 — 22,716 22,716
Private Education Loan securitizations (off-balance
sheet) . . ............................. — — — — 13,347 13,347 — 14,443 14,443
Indentured trusts (on-balance sheet) .............. — 1,246 1,246 64 1,533 1,597 31 1,972 2,003
Other
(1)
............................... 2,257 — 2,257 1,472 — 1,472 1,827 — 1,827
Total ................................. $33,389 $160,899 $194,288 $30,883 $160,741 $191,624 $41,933 $152,022 $193,955
(1) At December 31, 2010, “other” primarily consisted of $0.9 billion of cash collateral held related to derivative exposures that are
recorded as a short-term debt obligation, as well as $1.4 billion of unsecured other bank deposits. At December 31, 2009 and 2008,
“other” primarily consisted of cash collateral held related to derivative exposures that are recorded as short-term debt obligations.
80


