Sallie Mae 2010 Annual Report Download - page 184
Download and view the complete annual report
Please find page 184 of the 2010 Sallie Mae annual report below. You can navigate through the pages in the report by either clicking on the pages listed below, or by using the keyword search tool below to find specific information within the annual report.-
 1
1 -
2
-
3
-
4
-
5
-
6
-
7
-
8
-
9
-
10
-
11
-
12
-
13
-
14
-
15
-
16
-
17
-
18
-
19
-
20
-
21
-
22
-
23
-
24
-
25
-
26
-
27
-
28
-
29
-
30
-
31
-
32
-
33
-
34
-
35
-
36
-
37
-
38
-
39
-
40
-
41
-
42
-
43
-
44
-
45
-
46
-
47
-
48
-
49
-
50
-
51
-
52
-
53
-
54
-
55
-
56
-
57
-
58
-
59
-
60
-
61
-
62
-
63
-
64
-
65
-
66
-
67
-
68
-
69
-
70
-
71
-
72
-
73
-
74
-
75
-
76
-
77
-
78
-
79
-
80
-
81
-
82
-
83
-
84
-
85
-
86
-
87
-
88
-
89
-
90
-
91
-
92
-
93
-
94
-
95
-
96
-
97
-
98
-
99
-
100
-
101
-
102
-
103
-
104
-
105
-
106
-
107
-
108
-
109
-
110
-
111
-
112
-
113
-
114
-
115
-
116
-
117
-
118
-
119
-
120
-
121
-
122
-
123
-
124
-
125
-
126
-
127
-
128
-
129
-
130
-
131
-
132
-
133
-
134
-
135
-
136
-
137
-
138
-
139
-
140
-
141
-
142
-
143
-
144
-
145
-
146
-
147
-
148
-
149
-
150
-
151
-
152
-
153
-
154
-
155
-
156
-
157
-
158
-
159
-
160
-
161
-
162
-
163
-
164
-
165
-
166
-
167
-
168
-
169
-
170
-
171
-
172
-
173
-
 174
174 -
 175
175 -
 176
176 -
 177
177 -
 178
178 -
 179
179 -
 180
180 -
 181
181 -
 182
182 -
 183
183 -
 184
184 -
 185
185 -
 186
186 -
 187
187 -
 188
188 -
 189
189 -
 190
190 -
 191
191 -
 192
192 -
 193
193 -
 194
194 -
195
-
196
-
197
-
198
-
199
-
200
-
201
-
202
-
203
-
204
-
205
-
206
-
207
-
208
-
209
-
210
-
211
-
212
-
213
-
214
-
215
-
216
-
217
-
218
-
219
-
220
-
221
-
222
-
223
-
224
-
225
-
226
 |
 |

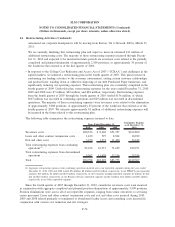
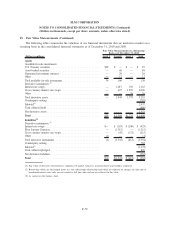
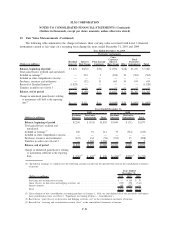
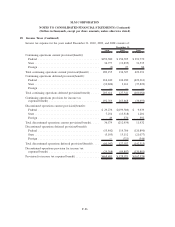
15. Fair Value Measurements (Continued)
The following table summarizes the change in balance sheet carrying value associated with Level 3 financial
instruments carried at fair value on a recurring basis during the years ended December 31, 2010 and 2009.
(Dollars in millions)
Residual
Interests
Interest
Rate Swaps
Floor Income
Contracts
Cross
Currency
Interest
Rate Swaps Other
Total
Derivative
Instruments Total
Derivative instruments
Year Ended December 31, 2010
Balance, beginning of period ........... $1,828 $(272) $(54) $ 1,596 $(18) $1,252 $ 3,080
Total gains/(losses) (realized and unrealized):
Included in earnings
(1)
................ — 234 3 (834) 34 (563) (563)
Included in other comprehensive income . . . . — — — — — — —
Purchases, issuances and settlements . . . . . . — (52) 51 665 10 674 674
Removal of Residual Interests
(2)
......... (1,828) — — — — — (1,828)
Transfers in and/or out of level 3 . . ....... — — — — — — —
Balance, end of period ............... $ — $ (90) $ — $ 1,427 $ 26 $1,363 $ 1,363
Change in unrealized gains/(losses) relating
to instruments still held at the reporting
date
(3)
.......................... $ — $111 $— $(1,010) $ 36 $ (863) $ (863)
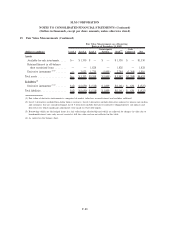
(Dollars in millions)
Residual
Interests
Derivative
Instruments Total
Residual
Interests
Derivative
Instruments Total
2009 2008
Years Ended December 31,
Balance, beginning of period .......... $2,200 $ (341) $1,859 $3,044 $ (71) $2,973
Total gains/(losses) (realized and
unrealized):
Included in earnings
(1)
............... 120 91 211 79 (314) (235)
Included in other comprehensive income . . . — — — — — —
Purchases, issuances and settlements. . . . . . (492) 434 (58) (923) 35 (888)
Transfers in and/or out of Level 3 . . . . . . . — 1,068 1,068 — 9 9
Balance, end of period .............. $1,828 $1,252 $3,080 $2,200 $(341) $1,859
Change in unrealized gains/(losses) relating
to instruments still held at the reporting
date . . . . ...................... $(330)
(4)
$ 439
(3)
$ 109 $ (424)
(2)
$(298)
(3)
$ (722)
(1) “Included in earnings” is comprised of the following amounts recorded in the specified line item in the consolidated statements
of income:
(Dollars in millions) 2010 2009 2008
Years Ended
December 31,
Servicing and securitization revenue . .................................... $ — $120 $ 79
Gains (losses) on derivative and hedging activities, net ......................... (732) 298 (314)
Interest expense .................................................. 169 (207) —
Total . ........................................................ $(563) $ 211 $(235)
(2) Upon adoption of new consolidation accounting guidance on January 1, 2010, we consolidated all of our previously off-balance
sheet securitization trusts (see Note 2, “Significant Accounting Policies — Consolidation”).
(3) Recorded in “gains (losses) on derivative and hedging activities, net” in the consolidated statements of income.
(4) Recorded in “servicing and securitization revenue (loss)” in the consolidated statements of income.
F-81
SLM CORPORATION
NOTES TO CONSOLIDATED FINANCIAL STATEMENTS (Continued)
(Dollars in thousands, except per share amounts, unless otherwise stated)