Sallie Mae 2010 Annual Report Download - page 174
Download and view the complete annual report
Please find page 174 of the 2010 Sallie Mae annual report below. You can navigate through the pages in the report by either clicking on the pages listed below, or by using the keyword search tool below to find specific information within the annual report.-
 1
1 -
2
-
3
-
4
-
5
-
6
-
7
-
8
-
9
-
10
-
11
-
12
-
13
-
14
-
15
-
16
-
17
-
18
-
19
-
20
-
21
-
22
-
23
-
24
-
25
-
26
-
27
-
28
-
29
-
30
-
31
-
32
-
33
-
34
-
35
-
36
-
37
-
38
-
39
-
40
-
41
-
42
-
43
-
44
-
45
-
46
-
47
-
48
-
49
-
50
-
51
-
52
-
53
-
54
-
55
-
56
-
57
-
58
-
59
-
60
-
61
-
62
-
63
-
64
-
65
-
66
-
67
-
68
-
69
-
70
-
71
-
72
-
73
-
74
-
75
-
76
-
77
-
78
-
79
-
80
-
81
-
82
-
83
-
84
-
85
-
86
-
87
-
88
-
89
-
90
-
91
-
92
-
93
-
94
-
95
-
96
-
97
-
98
-
99
-
100
-
101
-
102
-
103
-
104
-
105
-
106
-
107
-
108
-
109
-
110
-
111
-
112
-
113
-
114
-
115
-
116
-
117
-
118
-
119
-
120
-
121
-
122
-
123
-
124
-
125
-
126
-
127
-
128
-
129
-
130
-
131
-
132
-
133
-
134
-
135
-
136
-
137
-
138
-
139
-
140
-
141
-
142
-
143
-
144
-
145
-
146
-
147
-
148
-
149
-
150
-
151
-
152
-
153
-
154
-
155
-
156
-
157
-
158
-
159
-
160
-
161
-
162
-
163
-
 164
164 -
 165
165 -
 166
166 -
 167
167 -
 168
168 -
 169
169 -
 170
170 -
 171
171 -
 172
172 -
 173
173 -
 174
174 -
 175
175 -
 176
176 -
 177
177 -
 178
178 -
 179
179 -
 180
180 -
 181
181 -
 182
182 -
 183
183 -
 184
184 -
185
-
186
-
187
-
188
-
189
-
190
-
191
-
192
-
193
-
194
-
195
-
196
-
197
-
198
-
199
-
200
-
201
-
202
-
203
-
204
-
205
-
206
-
207
-
208
-
209
-
210
-
211
-
212
-
213
-
214
-
215
-
216
-
217
-
218
-
219
-
220
-
221
-
222
-
223
-
224
-
225
-
226
 |
 |

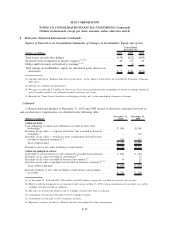
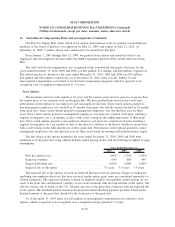
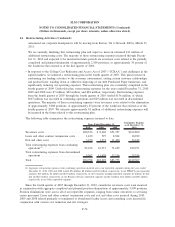
13. Stock-Based Compensation Plans and Arrangements (Continued)
On May 17, 2010, we launched a one-time stock option exchange program to allow certain eligible
employees (excluding our named executive officers and members of our Board of Directors) to exchange
certain out-of-the-money options for new options with an exercise price equal to the fair market value of our
stock as of the grant date. To be eligible for the exchange, the options had to have been granted on or before
January 31, 2008, had an exercise price that was greater than or equal to $20.94 per share, had a remaining
term that expired after January 1, 2011 and were outstanding as of the start date of the offer and at the time
the offer expired. The offering period closed on June 14, 2010. On that date, 15.1 million options were
tendered and exchanged for 8.0 million new options with an exercise price of $11.39. None of the replacement
options were vested on the date of grant. Replacement options will vest in six months, twelve months or two
annual installments following the grant date, depending on the original vesting status and vesting terms of the
eligible options, and will maintain the original contractual term of the eligible options for which they were
exchanged. The exchange program was designed so that the fair market value of the new options would not be
greater than the fair market value of the options exchanged, and as a result, this stock option exchange did not
result in incremental compensation expense to us.
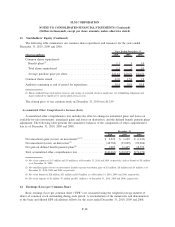
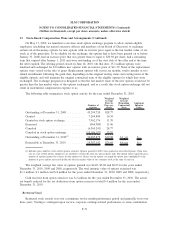
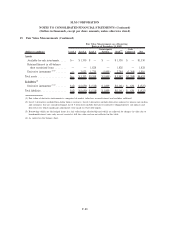
The following table summarizes stock option activity for the year ended December 31, 2010.
Number of
Options
Weighted
Average
Exercise
Price per
Share
Weighted
Average
Remaining
Contractual
Term
Aggregate
Intrinsic
Value
Outstanding at December 31, 2009 ........... 43,294,720 $28.77
Granted ............................... 7,264,800 10.34
Granted in stock option exchange ............ 7,962,176 11.39
Exercised .............................. (964,380) 11.06
Canceled .............................. (6,365,241) 24.77
Canceled in stock option exchange ........... (15,106,197) 35.87
Outstanding at December 31, 2010
(1)
......... 36,085,878 $19.88 6.1 yrs $—
Exercisable at December 31, 2010 ........... 19,307,142 $26.69 4.6 yrs $—
(1) Includes gross number of net-settled options awarded. Options granted in 2010 were granted as net-settled options. Upon exer-
cise of a net-settled option, employees are entitled to receive the after-tax spread shares only. The spread shares equal the gross
number of options granted less shares for the option cost. Shares for the option cost equal the option price multiplied by the
number of gross options exercised divided by the fair market value of our common stock at the time of exercise.
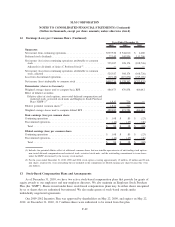
The weighted average fair value of options granted was $4.40, $5.82 and $6.93 for the years ended
December 31, 2010, 2009 and 2008, respectively. The total intrinsic value of options exercised was
$1.3 million, $.1 million and $.8 million for the years ended December 31, 2010, 2009 and 2008, respectively.
Cash received from option exercises was $.2 million for the year ended December 31, 2010. The actual
tax benefit realized for the tax deductions from option exercises totaled $.4 million for the year ended
December 31, 2010.
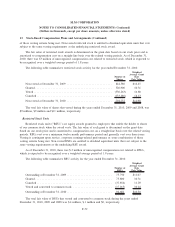
Restricted Stock
Restricted stock awards vest over a minimum twelve-month performance period and generally vests over
three years. Vesting is contingent upon service, corporate earnings-related performance or some combination
F-71
SLM CORPORATION
NOTES TO CONSOLIDATED FINANCIAL STATEMENTS (Continued)
(Dollars in thousands, except per share amounts, unless otherwise stated)