Sallie Mae 2010 Annual Report Download - page 200
Download and view the complete annual report
Please find page 200 of the 2010 Sallie Mae annual report below. You can navigate through the pages in the report by either clicking on the pages listed below, or by using the keyword search tool below to find specific information within the annual report.-
 1
1 -
2
-
3
-
4
-
5
-
6
-
7
-
8
-
9
-
10
-
11
-
12
-
13
-
14
-
15
-
16
-
17
-
18
-
19
-
20
-
21
-
22
-
23
-
24
-
25
-
26
-
27
-
28
-
29
-
30
-
31
-
32
-
33
-
34
-
35
-
36
-
37
-
38
-
39
-
40
-
41
-
42
-
43
-
44
-
45
-
46
-
47
-
48
-
49
-
50
-
51
-
52
-
53
-
54
-
55
-
56
-
57
-
58
-
59
-
60
-
61
-
62
-
63
-
64
-
65
-
66
-
67
-
68
-
69
-
70
-
71
-
72
-
73
-
74
-
75
-
76
-
77
-
78
-
79
-
80
-
81
-
82
-
83
-
84
-
85
-
86
-
87
-
88
-
89
-
90
-
91
-
92
-
93
-
94
-
95
-
96
-
97
-
98
-
99
-
100
-
101
-
102
-
103
-
104
-
105
-
106
-
107
-
108
-
109
-
110
-
111
-
112
-
113
-
114
-
115
-
116
-
117
-
118
-
119
-
120
-
121
-
122
-
123
-
124
-
125
-
126
-
127
-
128
-
129
-
130
-
131
-
132
-
133
-
134
-
135
-
136
-
137
-
138
-
139
-
140
-
141
-
142
-
143
-
144
-
145
-
146
-
147
-
148
-
149
-
150
-
151
-
152
-
153
-
154
-
155
-
156
-
157
-
158
-
159
-
160
-
161
-
162
-
163
-
164
-
165
-
166
-
167
-
168
-
169
-
170
-
171
-
172
-
173
-
174
-
175
-
176
-
177
-
178
-
179
-
180
-
181
-
182
-
183
-
184
-
185
-
186
-
187
-
188
-
189
-
 190
190 -
 191
191 -
 192
192 -
 193
193 -
 194
194 -
 195
195 -
 196
196 -
 197
197 -
 198
198 -
 199
199 -
 200
200 -
 201
201 -
 202
202 -
 203
203 -
 204
204 -
 205
205 -
 206
206 -
 207
207 -
 208
208 -
 209
209 -
 210
210 -
211
-
212
-
213
-
214
-
215
-
216
-
217
-
218
-
219
-
220
-
221
-
222
-
223
-
224
-
225
-
226
 |
 |

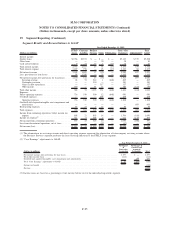
19. Segment Reporting (Continued)
(Dollars in millions)
FFELP
Loans
Consumer
Lending
Business
Services Other Eliminations
(1)
Total “Core
Earnings” Adjustments
(2)
Total
GAAP
Year Ended December 31, 2008
Interest income:
Student loans ....................... $6,052 $2,752 $ — $ — $ — $8,804 $(1,893) $6,911
Other loans ........................ — — — 83 — 83 — 83
Cash and investments .................. 156 79 26 95 (26) 330 (54) 276
Total interest income .................. 6,208 2,831 26 178 (26) 9,217 (1,947) 7,270
Total interest expense.................. 5,294 1,280 — 161 (26) 6,709 (804) 5,905
Net interest income (loss) ............... 914 1,551 26 17 — 2,508 (1,143) 1,365
Less: provisions for loan losses ........... 127 874 — 28 — 1,029 (309) 720
Net interest income (loss) after provisions for
loan losses ....................... 787 677 26 (11) — 1,479 (834) 645
Servicing revenue .................. 77 65 897 1 (632) 408 — 408
Contingency revenue ................ — — 330 — — 330 — 330
Gains on debt repurchases ............. — — — 64 — 64 — 64
Other income ..................... (42) 1 52 14 — 25 (355) (330)
Total other income ................... 35 66 1,279 79 (632) 827 (355) 472
Expenses:
Direct operating expenses ............... 745 201 462 17 (632) 793 — 793
Overhead expenses ................... — — — 236 — 236 — 236
Operating expenses ................. 745 201 462 253 (632) 1,029 — 1,029
Goodwill and acquired intangible assets
impairment and amortization ........... — — — — — — 50 50
Restructuring expenses ................. 42 25 10 (5) — 72 — 72
Total expenses ...................... 787 226 472 248 (632) 1,101 50 1,151
Income (loss) from continuing operations, before
income tax expense (benefit) ........... 35 517 833 (180) — 1,205 (1,239) (34)
Income tax expense (benefit)
(3)
............ 13 186 300 (65) — 434 (470) (36)
Net income (loss) from continuing operations . . 22 331 533 (115) — 771 (769) 2
Loss from discontinued operations, net of
taxes .......................... — — — (188) — (188) (27) (215)
Net income (loss) .................... $ 22 $ 331 $ 533 $(303) $ — $ 583 $ (796) $ (213)
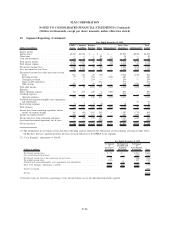
(1) The eliminations in servicing revenue and direct operating expense represent the elimination of intercompany servicing revenue where
the Business Services segment performs the loan servicing function for the FFELP Loans segment.
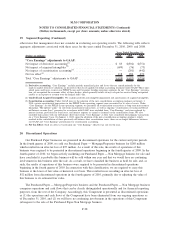
(2) “Core Earnings” adjustments to GAAP:
Net Impact
of
Derivative
Accounting
Net Impact of
Goodwill and
Acquired
Intangibles
Net Impact
of
Securitization
Accounting Total
Year Ended December 31, 2008
Net interest income (loss) .......................................... $(271) $ — $(872) $(1,143)
Less: provisions for loan losses ...................................... — — (309) (309)
Net interest income (loss) after provisions for loan losses ....................... (271) — (563) (834)
Total other income (loss) .......................................... (476) — 121 (355)
Goodwill and acquired intangible assets impairment and amortization . .............. — 50 — 50
Loss from continuing operations, before income tax expense . . ................... (747) (50) (442) (1,239)
Loss from discontinued operations, net of taxes. ............................ (4) (23) — (27)
Total “Core Earnings” adjustments to GAAP . . ............................ $(751) $(73) $(442) (1,266)
Income tax benefit . . . ........................................... (470)
Net loss .................................................... $ (796)
(3) Income taxes are based on a percentage of net income before tax for the individual reportable segment.
Summary of “Core Earnings” Adjustments to GAAP
The adjustments required to reconcile from our “Core Earnings” results to our GAAP results of
operations relate to differing treatments for securitization transactions, derivatives, Floor Income, and certain
F-97
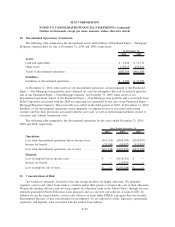
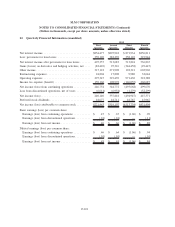
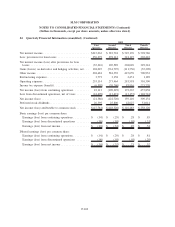
SLM CORPORATION
NOTES TO CONSOLIDATED FINANCIAL STATEMENTS (Continued)
(Dollars in thousands, except per share amounts, unless otherwise stated)