Sallie Mae 2010 Annual Report Download - page 134
Download and view the complete annual report
Please find page 134 of the 2010 Sallie Mae annual report below. You can navigate through the pages in the report by either clicking on the pages listed below, or by using the keyword search tool below to find specific information within the annual report.-
 1
1 -
2
-
3
-
4
-
5
-
6
-
7
-
8
-
9
-
10
-
11
-
12
-
13
-
14
-
15
-
16
-
17
-
18
-
19
-
20
-
21
-
22
-
23
-
24
-
25
-
26
-
27
-
28
-
29
-
30
-
31
-
32
-
33
-
34
-
35
-
36
-
37
-
38
-
39
-
40
-
41
-
42
-
43
-
44
-
45
-
46
-
47
-
48
-
49
-
50
-
51
-
52
-
53
-
54
-
55
-
56
-
57
-
58
-
59
-
60
-
61
-
62
-
63
-
64
-
65
-
66
-
67
-
68
-
69
-
70
-
71
-
72
-
73
-
74
-
75
-
76
-
77
-
78
-
79
-
80
-
81
-
82
-
83
-
84
-
85
-
86
-
87
-
88
-
89
-
90
-
91
-
92
-
93
-
94
-
95
-
96
-
97
-
98
-
99
-
100
-
101
-
102
-
103
-
104
-
105
-
106
-
107
-
108
-
109
-
110
-
111
-
112
-
113
-
114
-
115
-
116
-
117
-
118
-
119
-
120
-
121
-
122
-
123
-
 124
124 -
 125
125 -
 126
126 -
 127
127 -
 128
128 -
 129
129 -
 130
130 -
 131
131 -
 132
132 -
 133
133 -
 134
134 -
 135
135 -
 136
136 -
 137
137 -
 138
138 -
 139
139 -
 140
140 -
 141
141 -
 142
142 -
 143
143 -
 144
144 -
145
-
146
-
147
-
148
-
149
-
150
-
151
-
152
-
153
-
154
-
155
-
156
-
157
-
158
-
159
-
160
-
161
-
162
-
163
-
164
-
165
-
166
-
167
-
168
-
169
-
170
-
171
-
172
-
173
-
174
-
175
-
176
-
177
-
178
-
179
-
180
-
181
-
182
-
183
-
184
-
185
-
186
-
187
-
188
-
189
-
190
-
191
-
192
-
193
-
194
-
195
-
196
-
197
-
198
-
199
-
200
-
201
-
202
-
203
-
204
-
205
-
206
-
207
-
208
-
209
-
210
-
211
-
212
-
213
-
214
-
215
-
216
-
217
-
218
-
219
-
220
-
221
-
222
-
223
-
224
-
225
-
226
 |
 |

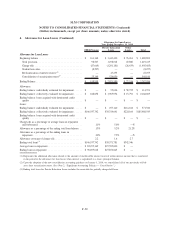
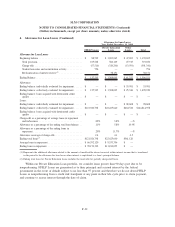
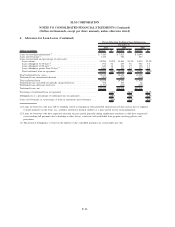
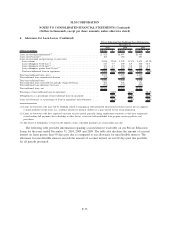
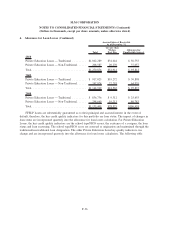
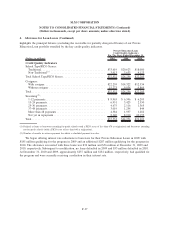
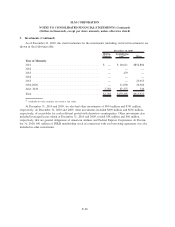
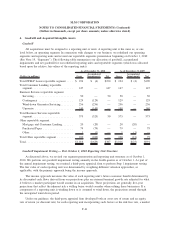
4. Allowance for Loan Losses (Continued)
FFELP Loans
Private Education
Loans
Other
Loans Total
Allowance for Loan Losses
Year Ended December 31, 2009
Allowance for Loan Losses
Beginning balance . . . . . . . . . . . . . . . . . . . . . . . . . . . . . . $ 137,543 $ 1,308,043 $ 61,325 $ 1,506,911
Total provision . . . . . . . . . . . . . . . . . . . . . . . . . . . . . . . 106,221 966,591 46,148 1,118,960
Charge-offs . . . . . . . . . . . . . . . . . . . . . . . . . . . . . . . . . (78,861) (875,667) (31,212) (985,740)
Student loan sales and securitization activity . . . . . . . . . . . (3,735) — — (3,735)
Reclassification of interest reserve
(1)
. . . . . . . . . . . . . . . . — 44,473 — 44,473
Ending Balance . . . . . . . . . . . . . . . . . . . . . . . . . . . . . . . . $ 161,168 $ 1,443,440 $ 76,261 $ 1,680,869
Allowance:
Ending balance: individually evaluated for impairment. . . . . . $ — $ 32,473 $ 56,760 $ 89,233
Ending balance: collectively evaluated for impairment . . . . . . $ 161,168 $ 1,410,967 $ 19,501 $ 1,591,636
Ending balance: loans acquired with deteriorated credit
quality . . . . . . . . . . . . . . . . . . . . . . . . . . . . . . . . . . . . $ — $ — $ — $ —
Loans:
Ending balance: individually evaluated for impairment. . . . . . $ — $ 181,254 $128,080 $ 309,334
Ending balance: collectively evaluated for impairment . . . . . . $119,026,931 $24,574,344 $310,176 $143,911,451
Ending balance: loans acquired with deteriorated credit
quality . . . . . . . . . . . . . . . . . . . . . . . . . . . . . . . . . . . . $ — $ — $ — $ —
Charge-offs as a percentage of average loans in repayment
and forbearance . . . . . . . . . . . . . . . . . . . . . . . . . . . . . . .11% 7.2% —%
Allowance as a percentage of the ending total loan balance . . .14% 5.8% 17.4%
Allowance as a percentage of the ending loans in
repayment . . . . . . . . . . . . . . . . . . . . . . . . . . . . . . . . . . .23% 10.0% —%
Allowance coverage of charge-offs . . . . . . . . . . . . . . . . . . . 2.0 1.6 2.4
Ending total loans
(2)
. . . . . . . . . . . . . . . . . . . . . . . . . . . . . $119,026,931 $24,755,598 $438,256
Average loans in repayment . . . . . . . . . . . . . . . . . . . . . . . . $ 69,020,295 $12,137,430 $ —
Ending loans in repayment . . . . . . . . . . . . . . . . . . . . . . . . $ 69,826,790 $14,379,102 $ —
(1) Represents the additional allowance related to the amount of uncollectible interest reserved within interest income that is transferred
in the period to the allowance for loan losses when interest is capitalized to a loan’s principal balance.
(2) Ending total loans for Private Education Loans includes the receivable for partially charged-off loans.
F-31
SLM CORPORATION
NOTES TO CONSOLIDATED FINANCIAL STATEMENTS (Continued)
(Dollars in thousands, except per share amounts, unless otherwise stated)