Sallie Mae 2010 Annual Report Download - page 82
Download and view the complete annual report
Please find page 82 of the 2010 Sallie Mae annual report below. You can navigate through the pages in the report by either clicking on the pages listed below, or by using the keyword search tool below to find specific information within the annual report.-
 1
1 -
2
-
3
-
4
-
5
-
6
-
7
-
8
-
9
-
10
-
11
-
12
-
13
-
14
-
15
-
16
-
17
-
18
-
19
-
20
-
21
-
22
-
23
-
24
-
25
-
26
-
27
-
28
-
29
-
30
-
31
-
32
-
33
-
34
-
35
-
36
-
37
-
38
-
39
-
40
-
41
-
42
-
43
-
44
-
45
-
46
-
47
-
48
-
49
-
50
-
51
-
52
-
53
-
54
-
55
-
56
-
57
-
58
-
59
-
60
-
61
-
62
-
63
-
64
-
65
-
66
-
67
-
68
-
69
-
70
-
71
-
 72
72 -
 73
73 -
 74
74 -
 75
75 -
 76
76 -
 77
77 -
 78
78 -
 79
79 -
 80
80 -
 81
81 -
 82
82 -
 83
83 -
 84
84 -
 85
85 -
 86
86 -
 87
87 -
 88
88 -
 89
89 -
 90
90 -
 91
91 -
 92
92 -
93
-
94
-
95
-
96
-
97
-
98
-
99
-
100
-
101
-
102
-
103
-
104
-
105
-
106
-
107
-
108
-
109
-
110
-
111
-
112
-
113
-
114
-
115
-
116
-
117
-
118
-
119
-
120
-
121
-
122
-
123
-
124
-
125
-
126
-
127
-
128
-
129
-
130
-
131
-
132
-
133
-
134
-
135
-
136
-
137
-
138
-
139
-
140
-
141
-
142
-
143
-
144
-
145
-
146
-
147
-
148
-
149
-
150
-
151
-
152
-
153
-
154
-
155
-
156
-
157
-
158
-
159
-
160
-
161
-
162
-
163
-
164
-
165
-
166
-
167
-
168
-
169
-
170
-
171
-
172
-
173
-
174
-
175
-
176
-
177
-
178
-
179
-
180
-
181
-
182
-
183
-
184
-
185
-
186
-
187
-
188
-
189
-
190
-
191
-
192
-
193
-
194
-
195
-
196
-
197
-
198
-
199
-
200
-
201
-
202
-
203
-
204
-
205
-
206
-
207
-
208
-
209
-
210
-
211
-
212
-
213
-
214
-
215
-
216
-
217
-
218
-
219
-
220
-
221
-
222
-
223
-
224
-
225
-
226
 |
 |

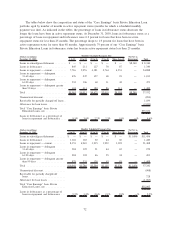
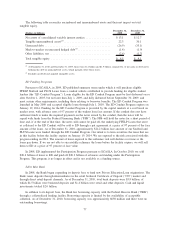
Secured borrowings, including securitizations, asset-backed commercial paper (“ABCP”) borrowings,
ED financing facilities and indentured trusts, comprised 85 percent of our “Core Earnings” basis debt
outstanding at December 31, 2010 versus 82 percent at December 31, 2009.
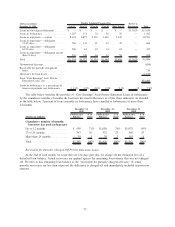
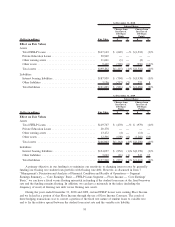
Average Balances
(Dollars in millions)
Average
Balance
Average
Rate
Average
Balance
Average
Rate
Average
Balance
Average
Rate
2010 2009 2008
Years Ended December 31,
Unsecured borrowings ............... $ 24,480 2.15% $ 31,863 1.93% $ 39,794 3.65%
Unsecured term bank deposits ......... 5,123 2.65 4,754 3.50 854 4.07
FHLB-DM facility .................. 403 .35 — — — —
ED Participation Program facility (on-
balance sheet) ................... 13,537 .81 14,174 1.43 1,727 3.43
ED Conduit Program facility (on-balance
sheet) .......................... 15,096 .70 7,340 .75 — —
ABCP borrowings (on-balance sheet)
(1)
. . . 6,623 1.24 16,239 2.93 24,855 5.27
Securitizations (on-balance sheet) ....... 120,880 1.00 85,612 1.38 76,028 3.26
Securitizations (off-balance sheet)....... — — 35,377 .82 39,625 3.11
Indentured trusts (on-balance sheet) ..... 1,454 .69 1,811 1.07 2,363 3.90
Other ............................ 1,806 .55 1,391 .31 2,063 2.35
Total ............................ $189,402 1.16% $198,561 1.51% $187,309 3.58%
(1) Included the 2008 Asset-Backed Loan Facility through April 2009.
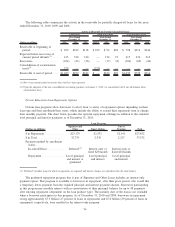
Contractual Cash Obligations
The following table provides a summary of our obligations associated with long-term notes at
December 31, 2010. For further discussion of these obligations, see “Note 7 — Borrowings.”
(Dollars in millions)
1 Year
or Less
2to3
Years
4to5
Years
Over
5 Years Total
Long-term notes:
Unsecured borrowings ................ $ — $ 4,137 $ 4,552 $ 7,053 $ 15,742
Unsecured term bank deposits .......... — 2,290 811 59 3,160
Secured borrowings
(1)
................ 16,255 25,818 19,100 80,824 141,997
Total contractual cash obligations
(2)
...... $16,255 $32,245 $24,463 $87,936 $160,899
(1) Includes long-term beneficial interests of $133.8 billion of notes issued by consolidated VIEs in conjunction with our on-balance
sheet securitization transactions and included in long-term notes in the consolidated balance sheet. Timing of obligations is esti-
mated based on our current projection of prepayment speeds of the securitized assets.
(2) The aggregate principal amount of debt that matures in each period is $16.3 billion, $32.4 billion, $24.6 billion and $88.7 billion,
respectively. Specifically excludes derivative market value adjustments of $2.6 billion for long-term notes. Interest obligations on
notes are predominantly variable in nature, resetting quarterly based on 3-month LIBOR.
Unrecognized tax benefits were $39 million and $101 million for the years ended December 31, 2010 and
2009, respectively. For additional information, see “Note 18 — Income Taxes.”
81