Sallie Mae 2010 Annual Report Download - page 27
Download and view the complete annual report
Please find page 27 of the 2010 Sallie Mae annual report below. You can navigate through the pages in the report by either clicking on the pages listed below, or by using the keyword search tool below to find specific information within the annual report.-
 1
1 -
2
-
3
-
4
-
5
-
6
-
7
-
8
-
9
-
10
-
11
-
12
-
13
-
14
-
15
-
16
-
 17
17 -
 18
18 -
 19
19 -
 20
20 -
 21
21 -
 22
22 -
 23
23 -
 24
24 -
 25
25 -
 26
26 -
 27
27 -
 28
28 -
 29
29 -
 30
30 -
 31
31 -
 32
32 -
 33
33 -
 34
34 -
 35
35 -
 36
36 -
 37
37 -
38
-
39
-
40
-
41
-
42
-
43
-
44
-
45
-
46
-
47
-
48
-
49
-
50
-
51
-
52
-
53
-
54
-
55
-
56
-
57
-
58
-
59
-
60
-
61
-
62
-
63
-
64
-
65
-
66
-
67
-
68
-
69
-
70
-
71
-
72
-
73
-
74
-
75
-
76
-
77
-
78
-
79
-
80
-
81
-
82
-
83
-
84
-
85
-
86
-
87
-
88
-
89
-
90
-
91
-
92
-
93
-
94
-
95
-
96
-
97
-
98
-
99
-
100
-
101
-
102
-
103
-
104
-
105
-
106
-
107
-
108
-
109
-
110
-
111
-
112
-
113
-
114
-
115
-
116
-
117
-
118
-
119
-
120
-
121
-
122
-
123
-
124
-
125
-
126
-
127
-
128
-
129
-
130
-
131
-
132
-
133
-
134
-
135
-
136
-
137
-
138
-
139
-
140
-
141
-
142
-
143
-
144
-
145
-
146
-
147
-
148
-
149
-
150
-
151
-
152
-
153
-
154
-
155
-
156
-
157
-
158
-
159
-
160
-
161
-
162
-
163
-
164
-
165
-
166
-
167
-
168
-
169
-
170
-
171
-
172
-
173
-
174
-
175
-
176
-
177
-
178
-
179
-
180
-
181
-
182
-
183
-
184
-
185
-
186
-
187
-
188
-
189
-
190
-
191
-
192
-
193
-
194
-
195
-
196
-
197
-
198
-
199
-
200
-
201
-
202
-
203
-
204
-
205
-
206
-
207
-
208
-
209
-
210
-
211
-
212
-
213
-
214
-
215
-
216
-
217
-
218
-
219
-
220
-
221
-
222
-
223
-
224
-
225
-
226
 |
 |
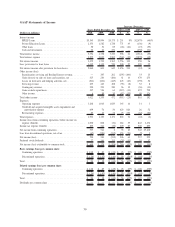
Other Income/(Loss)
In managing our loan portfolios and funding sources we periodically engage in sales of loans and the
repurchase of our outstanding debt. In each case, depending on market conditions, we may incur gains or
losses from these transactions that affect our results from operations. We also recognize gains and losses in
accordance with GAAP on our derivative and hedging activities from the changes in the fair value of
derivatives that do not qualify for hedge accounting treatment and ineffectiveness on derivatives that do qualify
for hedge accounting.
Operating Expenses
The operating expenses reported for our Consumer Lending and Business Services segments are those
that are directly attributable to the generation of revenues by those segments. The operating expenses for the
FFELP Loans segment primarily represent an intercompany servicing charge from the Business Services
segment and do not reflect our actual underlying costs incurred to service the loans. We have included
corporate overhead expenses and certain information technology costs (together referred to as “Overhead”) in
our Other segment rather than allocate those expenses by segment. These overhead expenses include costs
related to executive management, the board of directors, accounting, finance, legal, human resources, stock
option expense and certain information technology costs related to infrastructure and operations.
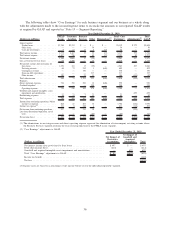
Core Earnings
Management uses “Core Earnings” as the primary financial performance measure to evaluate performance
and to allocate resources. “Core Earnings” is the basis in which we prepare our segment disclosures as
required by GAAP under ASC 280 “Segment Reporting” (see “Note 19—Segment Reporting”). For a full
explanation of the contents and limitations of “Core Earnings” see ‘‘‘Core Earnings’—Definition and
Limitations” of this Item 7.
2010 Summary
We overcame considerable challenges and achieved significant accomplishments in 2010. We continue to
operate in an extremely challenging macroeconomic environment marked by high unemployment and periods
of extreme illiquidity in the capital markets.
Effective July 1, 2010, HCERA eliminated FFELP Loan originations, a major source of our net income.
As a result, we will no longer have revenue related to FFELP Loan originations and will have declining net
income related to our portfolio of FFELP Loans and related FFELP Loan servicing and collections activities.
HCERA does not alter or affect the terms and conditions of our existing FFELP Loans. Net interest income
we earn on our FFELP Loan portfolio will decline over time as the portfolio amortizes. We will no longer
earn any origination fees for originating FFELP Loans (which was $34 million in 2010) and the Guarantor
maintenance fees (which was $56 million in 2010) will decline as the portfolio pays down. In addition, we
earned $245 million in FFELP contingency revenue in 2010, which we expect to remain relatively stable
through 2012 and then steadily decline as the portfolio of defaulted FFELP Loans we manage is resolved and
amortizes.
In response to these legislative and economic challenges we explored splitting the Company into two
publicly traded companies, representing our runoff and growth businesses. We also explored selling our
residual interests in our securitized FFELP Loans to effectively remove the securitized loans from our balance
sheet. After evaluating both strategies we determined that neither strategy currently provides better economic
returns to investors than our current operating structure.
On December 31, 2010, we closed on our agreement to purchase the $26.1 billion of securitized federal
loans and related assets from the Student Loan Corporation. This transaction will be accretive to 2011 earnings
and beyond. We continue to seek to acquire FFELP Loan portfolios.
Despite the economic environment, we saw significant improvements in the quality of our lending
business segments.
26