Sallie Mae 2010 Annual Report Download - page 58
Download and view the complete annual report
Please find page 58 of the 2010 Sallie Mae annual report below. You can navigate through the pages in the report by either clicking on the pages listed below, or by using the keyword search tool below to find specific information within the annual report.-
 1
1 -
2
-
3
-
4
-
5
-
6
-
7
-
8
-
9
-
10
-
11
-
12
-
13
-
14
-
15
-
16
-
17
-
18
-
19
-
20
-
21
-
22
-
23
-
24
-
25
-
26
-
27
-
28
-
29
-
30
-
31
-
32
-
33
-
34
-
35
-
36
-
37
-
38
-
39
-
40
-
41
-
42
-
43
-
44
-
45
-
46
-
47
-
 48
48 -
 49
49 -
 50
50 -
 51
51 -
 52
52 -
 53
53 -
 54
54 -
 55
55 -
 56
56 -
 57
57 -
 58
58 -
 59
59 -
 60
60 -
 61
61 -
 62
62 -
 63
63 -
 64
64 -
 65
65 -
 66
66 -
 67
67 -
 68
68 -
69
-
70
-
71
-
72
-
73
-
74
-
75
-
76
-
77
-
78
-
79
-
80
-
81
-
82
-
83
-
84
-
85
-
86
-
87
-
88
-
89
-
90
-
91
-
92
-
93
-
94
-
95
-
96
-
97
-
98
-
99
-
100
-
101
-
102
-
103
-
104
-
105
-
106
-
107
-
108
-
109
-
110
-
111
-
112
-
113
-
114
-
115
-
116
-
117
-
118
-
119
-
120
-
121
-
122
-
123
-
124
-
125
-
126
-
127
-
128
-
129
-
130
-
131
-
132
-
133
-
134
-
135
-
136
-
137
-
138
-
139
-
140
-
141
-
142
-
143
-
144
-
145
-
146
-
147
-
148
-
149
-
150
-
151
-
152
-
153
-
154
-
155
-
156
-
157
-
158
-
159
-
160
-
161
-
162
-
163
-
164
-
165
-
166
-
167
-
168
-
169
-
170
-
171
-
172
-
173
-
174
-
175
-
176
-
177
-
178
-
179
-
180
-
181
-
182
-
183
-
184
-
185
-
186
-
187
-
188
-
189
-
190
-
191
-
192
-
193
-
194
-
195
-
196
-
197
-
198
-
199
-
200
-
201
-
202
-
203
-
204
-
205
-
206
-
207
-
208
-
209
-
210
-
211
-
212
-
213
-
214
-
215
-
216
-
217
-
218
-
219
-
220
-
221
-
222
-
223
-
224
-
225
-
226
 |
 |

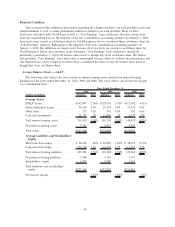
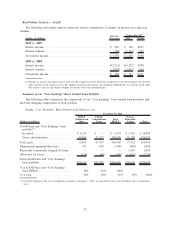
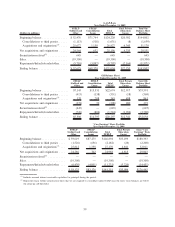
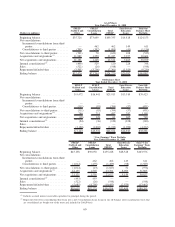
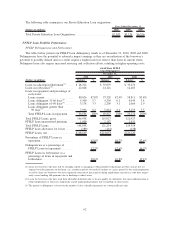
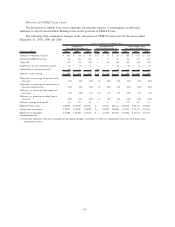
Average “Core Earnings” Basis Student Loan Balances (net of unamortized premium/discount)
The following tables summarize the components of our “Core Earnings” basis student loan portfolios and
show the changing composition of each portfolio.
(Dollars in millions)
FFELP
Stafford and
Other
FFELP
Consolidation
Loans Total FFELP
Private
Education
Loans Total
Year Ended December 31, 2010
Total GAAP-basis and “Core Earnings”
basis
(1)
......................... $61,034 $81,009 $142,043 $36,534 $178,577
% of GAAP-basis and “Core
Earnings” basis FFELP ............. 43% 57% 100%
% of total ..................... 34% 46% 80% 20% 100%
(Dollars in millions)
FFELP
Stafford and
Other
FFELP
Consolidation
Loans Total FFELP
Private
Education
Loans Total
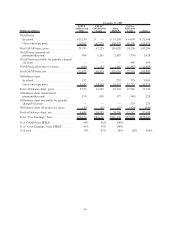
Year Ended December 31, 2009
GAAP-basis ....................... $58,492 $70,046 $128,538 $23,154 $151,692
Off-balance sheet ................... 6,365 15,156 21,521 12,892 34,413
Total “Core Earnings” basis ........... $64,857 $85,202 $150,059 $36,046 $186,105
% of GAAP-basis FFELP ......... 46% 54% 100%
% of “Core Earnings” basis FFELP . . 43% 57% 100%
% of total ..................... 35% 46% 81% 19% 100%
(Dollars in millions)
FFELP
Stafford and
Other
FFELP
Consolidation
Loans Total FFELP
Private
Education
Loans Total
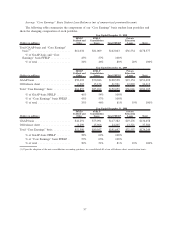
Year Ended December 31, 2008
GAAP-basis ....................... $44,291 $73,091 $117,382 $19,276 $136,658
Off-balance sheet ................... 8,299 15,966 24,265 13,321 37,586
Total “Core Earnings” basis ........... $52,590 $89,057 $141,647 $32,597 $174,244
% of GAAP-basis FFELP ......... 38% 62% 100%
% of “Core Earnings” basis FFELP . . 37% 63% 100%
% of total ..................... 30% 51% 81% 19% 100%
(1) Upon the adoption of the new consolidation accounting guidance, we consolidated all of our off-balance sheet securitization trusts.
57